

Review
doi: 10.1021/jm200371q.
Epub 2011 Jun 15.
Progress in structure based drug design for G protein-coupled receptors
Affiliations
- PMID: 21615150
- PMCID: PMC3308205
- DOI: 10.1021/jm200371q
Item in Clipboard
Review
Progress in structure based drug design for G protein-coupled receptors
J Med Chem.
.
Free PMC article
No abstract available
Figures
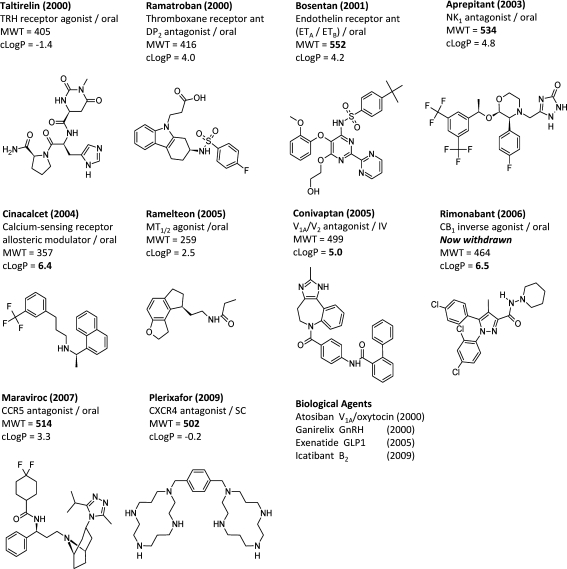
First in class GPCR targeted drugs launched in the past decade. The drug, year of launch, protein target, route of administration, MWT, and cLogP are given in each case. The biological drugs are shown next to the GPCR target and year of launch.

Overall structures of family A, family B, and family C GPCRs as a cartoon. The seven helices are labeled in each case, and N-terminal ECD is shown. The natural ligand is shown in green. In family B this is the “hot dog in a bun” model where the peptide is shown binding to the ECD and also to the TMD. In family C the ECD is the “Venus fly trap”; conformational change upon binding of ligand is thought to cause receptor signaling.

Common structural architecture of family A GPCRs revealed by X-ray crystallography. The structures of β1AR (green, 2VT4) and D3R (red, 3PBL) are overlaid and used as representative. The key features of the structures are illustrated (see main text for details).
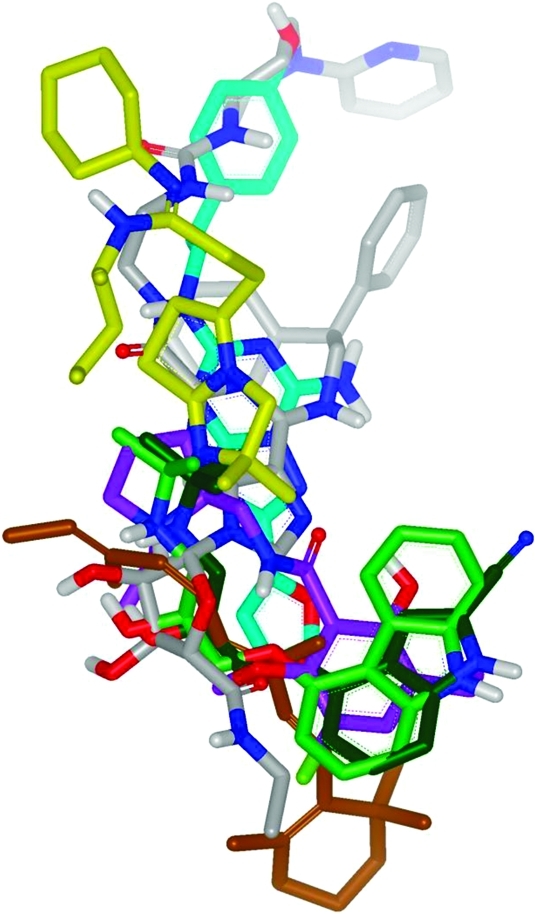
Superposition of ligands from seven different GPCR X-ray structures, based on Cα alignment of the GPCR protein structures: dark green = β1AR antagonist; light green = β2AR antagonist; cyan = A2AR antagonist; lilac = D3R antagonist; yellow = CXCR4 antagonist; brown = rhodopsin (inactive); gray = A2AR agonist.

TMD binding sites of published GPCRs illustrating protein–ligand interactions for agonists (cyan ligands) compared with antagonists (pink ligands): (A) general changes on antagonist to agonist transition exemplified using rhodopsin (red) and opsin (green); (B) rhodopsin agonist structure (green) 2X72 vs antagonist structure (red) 1HZX; (C) β2AR agonist structure (green) 3POG vs antagonist structure (red) 2RH1; (D) A2AR agonist structure (green) 3QAK vs antagonist structure (red) 3EML.

Comparison of antagonist and agonist ligands bound to the stabilized β1AR receptor complex, indicating new polar interactions formed upon agonist binding. Antagonist ligand in magenta (2VT4) and agonist in gray (3YO3).

(A) ECD of the CGRP receptor crystal structure (3N7S). Shown is the N-terminal domain CLR (green) in complex with RAMP 1 (red). (B) Olcegepant (blue) binds at the interface of CLR and RAMP 1.

(A) ECD of the mGlu3 receptor crystal structure complex bound to glutamate (2E4V). (B) DCG-IV complex indicating differences between mGlu1 (yellow) and mGlu3 (red) that give rise to selectivity.


(A) Comparison of a dopamine D3 receptor homology model based on the β2AR. (B) Homology model structure (green protein and green mesh carbon accessible surface from GRID calculated using the CH3 probe at 1 kcal/mol contour; piperazine ligand in green) and the X-ray structure of D3R (gray protein, X-ray ligand eticlopride and carbon accessible surface in transparent solid rendering). Two of the residues in the homology model that restrict the binding site are highlighted by being displayed in green colored stick.

Adenosine A2A binding site from the 3EML structure with the ZM241385 ligand with waters calculated (with no ligand present) using the WaterMap program from Schrödinger shown. These are color coded to show the most “unhappy” vs bulk solvent as red (>3.5 kcal/mol), then yellow (2.2–3.5 kcal/mol), with gray intermediate (−1 to 2.2 kcal), and blue “happy” (<1 kcal/mol). GRID maps highlight the shape (Csp3 (C3) at 1 kcal/mol in light gray) of the lipophilic hotspots (aromatic C–H probe (C1=) in yellow at −2.5 kcal/mol) and the water probe hotspots (in green at −6.6 kcal/mol). Note the large number of “unhappy” waters deep in the binding site that are not exploited by ZM241385.

Simplified description of family A GPCR binding sites in the antagonist and agonist conformational states. Antagonists bind to both H-bonding and lipophilic subsites in a more open form of the orthosteric pocket of the receptor. NAMs are proposed to occupy an allosteric pocket at the entrance to the receptor adjacent to ECL2. Agonists trigger a change in receptor conformation on binding to the antagonist state in which the volume of the binding site decreases and new polar interactions are formed deep inside the pocket close to the toggle switch W6.48. PAMs are proposed to stabilize the agonist state by binding to the allosteric pocket in an alternative conformation.

Potential for selectivity in β-adrenergic receptors: superimposition of crystal structures of cyanopindolol in β1AR (yellow) and carazolol in β2AR (blue) adrenoceptors. The surface of the pocket in β1AR slightly differs from the shape of the pocket in β2AR because of the lack of the phenol hydroxyl group in Phe325 (7.35) (β1) vs Tyr308 (7.35) (β2). This single atom change also affects the H-bonding of the adjacent Asn residue (6.55) in the binding site.
References
-
- Bikker J. A.; Trumpp-Kallmeyer S.; Humblet C. G-Protein coupled receptors: models, mutagenesis, and drug design. J. Med. Chem. 1998, 41 (16), 2911–2927. - PubMed
-
- Henderson R.; Schertler G. F. The structure of bacteriorhodopsin and its relevance to the visual opsins and other seven-helix G-protein coupled receptors. Philos. Trans. R. Soc. London, Ser. B 1990, 326 (1236), 379–389. - PubMed
-
- Schertler G. F.; Villa C.; Henderson R. Projection structure of rhodopsin. Nature 1993, 362 (6422), 770–772. - PubMed
-
- Lipinski C. A.; Lombardo F.; Dominy B. W.; Feeney P. J. Experimental and computational approaches to estimate solubility and permeability in drug discovery and development settings. Adv. Drug Delivery Rev. 2001, 46 (1–3), 3–26. - PubMed
-
- Leeson P. D.; Springthorpe B. The influence of drug-like concepts on decision-making in medicinal chemistry. Nat. Rev. Drug Discovery 2007, 6 (11), 881–890. - PubMed
Publication types
MeSH terms
Substances
LinkOut - more resources
Full Text Sources
Other Literature Sources
Chemical Information
