

Consumers' interpretation and use of comparative information on the quality of health care: the effect of presentation approaches
- PMID: 21615637
- PMCID: PMC5060615
- DOI: 10.1111/j.1369-7625.2011.00671.x
Consumers' interpretation and use of comparative information on the quality of health care: the effect of presentation approaches
Abstract
Background: Public reports about health-care quality have not been effectively used by consumers thus far. A possible explanation is inadequate presentation of the information.
Objective: To assess which presentation features contribute to consumers' correct interpretation and effective use of comparative health-care quality information and to examine the influence of consumer characteristics.
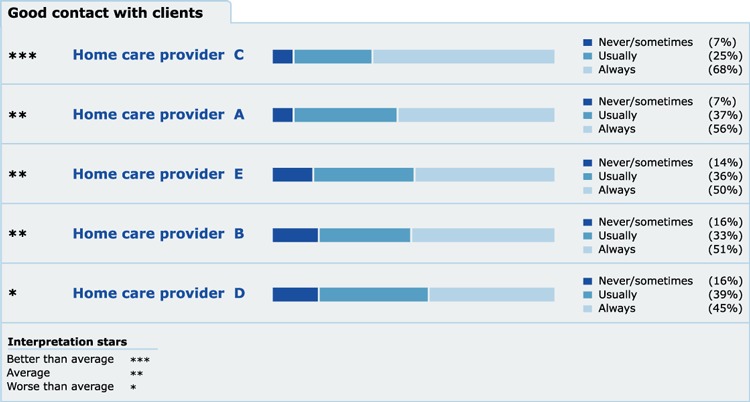
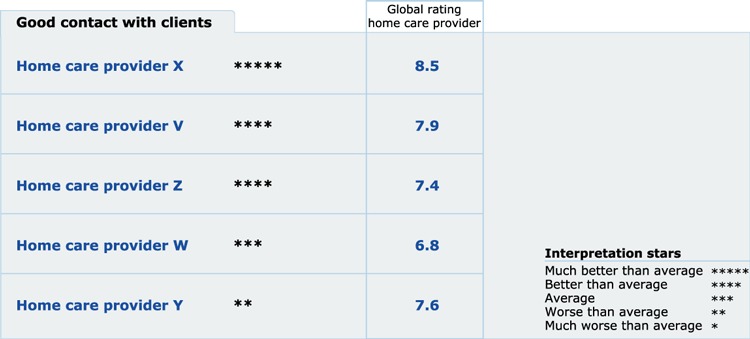
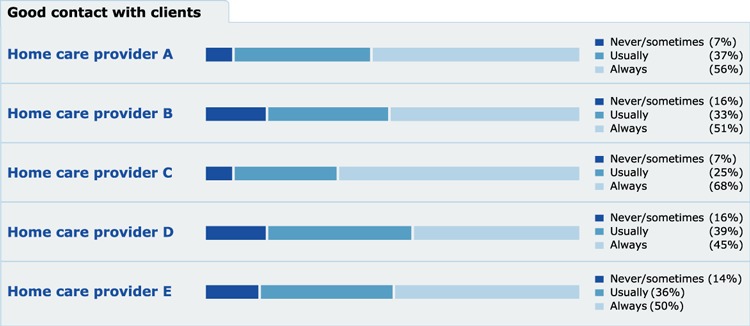
Design: Fictitious Consumer Quality Index (CQI) data on home care quality were used to construct experimental presentation formats of comparative information. These formats were selected using conjoint analysis methodology. We used multilevel regression analysis to investigate the effects of presenting bar charts and star ratings, ordering of the data, type of stars, number of stars and inclusion of a global rating.
Setting and participants: Data were collected during 2 weeks of online questioning of 438 members of an online access panel.
Results: Both presentation features and consumer characteristics (age and education) significantly affected consumers' responses. Formats using combinations of bar charts and stars, three stars, an alphabetical ordering of providers and no inclusion of a global rating supported consumers. The effects of the presentation features differed across the outcome variables.
Conclusions: Comparative information on the quality of home care is complex for consumers. Although our findings derive from an experimental situation, they provide several suggestions for optimizing the information on the Internet. More research is needed to further unravel the effects of presentation formats on consumer decision making in health care.
© 2011 Blackwell Publishing Ltd.
Figures
References
-
- Maarse H, Ter Meulen R. Consumer choice in Dutch health insurance after reform. Healthcare Analysis, 2006; 14: 37–49. - PubMed
-
- Bernstein AB, Gauthier AK. Choices in health care: what are they and what are they worth? Medical Care Research and Review, 1999; 3 (Suppl 1): 5–23. - PubMed
-
- Marshall M, Davies H. Public release of information on quality of care: how are health services and the public expected to respond? Journal of Health Services Research & Policy, 2001; 6: 158–162. - PubMed
-
- Berwick DM, James B, Coye MJ. Connections between quality measurement and improvement. Medical Care, 2003; 41 (1 Suppl): 130–138. - PubMed
-
- Hibbard JH. Engaging health care consumers to improve the quality of care. Medical Care, 2003; 41 (1 Suppl): 161–170. - PubMed
Publication types
MeSH terms
LinkOut - more resources
Full Text Sources
