Modelling the global constraints of temperature on transmission of Plasmodium falciparum and P. vivax
- PMID: 21615906
- PMCID: PMC3115897
- DOI: 10.1186/1756-3305-4-92
Modelling the global constraints of temperature on transmission of Plasmodium falciparum and P. vivax
Abstract
Background: Temperature is a key determinant of environmental suitability for transmission of human malaria, modulating endemicity in some regions and preventing transmission in others. The spatial modelling of malaria endemicity has become increasingly sophisticated and is now central to the global scale planning, implementation, and monitoring of disease control and regional efforts towards elimination, but existing efforts to model the constraints of temperature on the malaria landscape at these scales have been simplistic. Here, we define an analytical framework to model these constraints appropriately at fine spatial and temporal resolutions, providing a detailed dynamic description that can enhance large scale malaria cartography as a decision-support tool in public health.
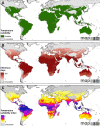
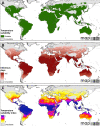
Results: We defined a dynamic biological model that incorporated the principal mechanisms of temperature dependency in the malaria transmission cycle and used it with fine spatial and temporal resolution temperature data to evaluate time-series of temperature suitability for transmission of Plasmodium falciparum and P. vivax throughout an average year, quantified using an index proportional to the basic reproductive number. Time-series were calculated for all 1 km resolution land pixels globally and were summarised to create high-resolution maps for each species delineating those regions where temperature precludes transmission throughout the year. Within suitable zones we mapped for each pixel the number of days in which transmission is possible and an integrated measure of the intensity of suitability across the year. The detailed evaluation of temporal suitability dynamics provided by the model is visualised in a series of accompanying animations.
Conclusions: These modelled products, made available freely in the public domain, can support the refined delineation of populations at risk; enhance endemicity mapping by offering a detailed, dynamic, and biologically driven alternative to the ubiquitous empirical incorporation of raw temperature data in geospatial models; and provide a rich spatial and temporal platform for future biological modelling studies.
Figures


References
-
- Nikolaev BP. On the influence of temperature on the development of malaria plasmodia inside the mosquito [in Russian] Leningrad Pasteur Institute of Epidemiology and Bacteriology. 1935;2:108–109.
-
- Lysenko AJ, Semashko IN. In: Itogi Nauki: Medicinskaja Geografija. Lebedew AW, editor. Moscow: Academy of Sciences; 1968. Geography of malaria. A medico-geographic profile of an ancient disease [in Russian] pp. 25–146.
Publication types
MeSH terms
Grants and funding
LinkOut - more resources
Full Text Sources

