. 2011 May 27:5:84.
doi: 10.1186/1752-0509-5-84.

Systems mapping: how to improve the genetic mapping of complex traits through design principles of biological systems

Affiliations

Systems mapping: how to improve the genetic mapping of complex traits through design principles of biological systems

Rongling Wu et al. BMC Syst Biol. .

Abstract

Background: Every phenotypic trait can be viewed as a "system" in which a group of interconnected components function synergistically to yield a unified whole. Once a system's components and their interactions have been delineated according to biological principles, we can manipulate and engineer functionally relevant components to produce a desirable system phenotype.

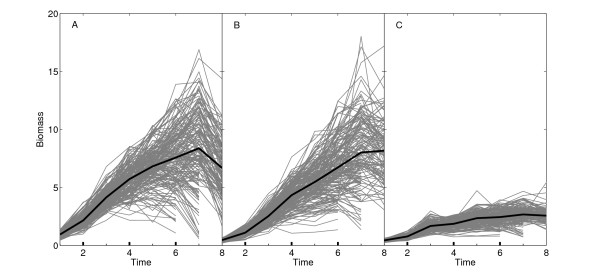
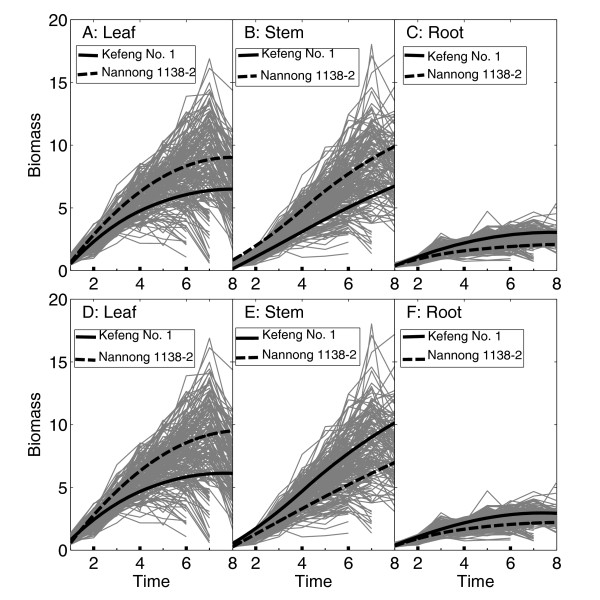
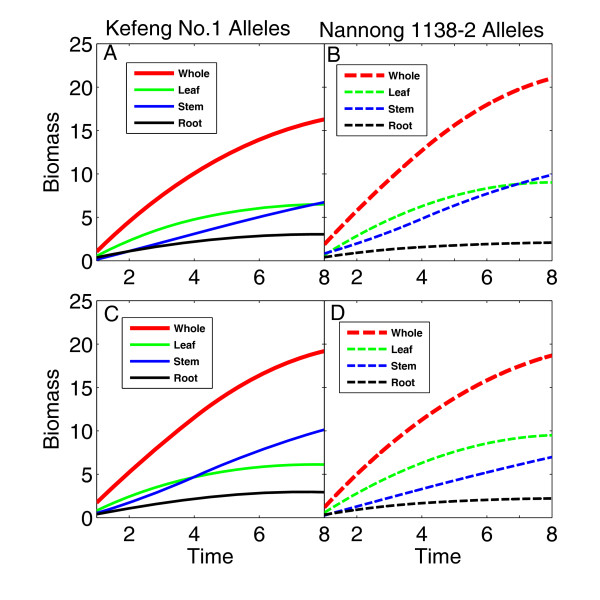
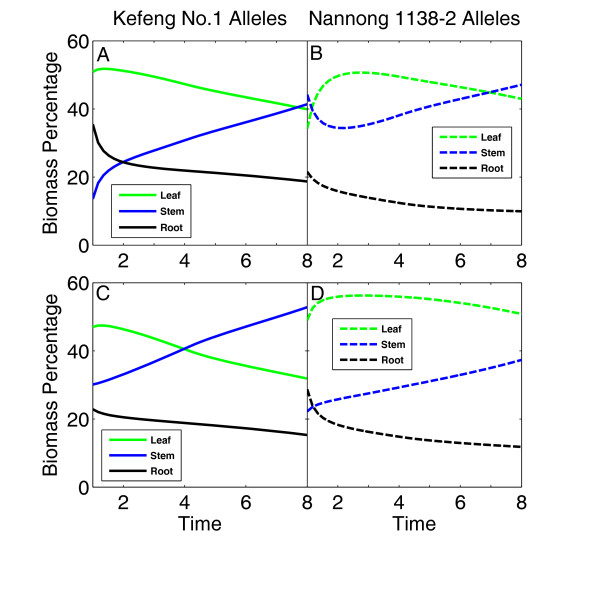
Results: We describe a conceptual framework for mapping quantitative trait loci (QTLs) that control complex traits by treating trait formation as a dynamic system. This framework, called systems mapping, incorporates a system of differential equations that quantifies how alterations of different components lead to the global change of trait development and function through genes, and provides a quantitative and testable platform for assessing the interplay between gene action and development. We applied systems mapping to analyze biomass growth data in a mapping population of soybeans and identified specific loci that are responsible for the dynamics of biomass partitioning to leaves, stem, and roots.

Conclusions: We show that systems mapping implemented by design principles of biological systems is quite versatile for deciphering the genetic machineries for size-shape, structural-functional, sink-source and pleiotropic relationships underlying plant physiology and development. Systems mapping should enable geneticists to shed light on the genetic complexity of any biological system in plants and other organisms and predict its physiological and pathological states.


Figures

Figure 1
Figure 1
Growth trajectories of leaf (A), stem (B) and root biomass (C) measured at multiple time points in a growing season of soybeans. Each grey line presents the growth trajectory of one of 184 RILs, whereas black lines are the mean growth trajectories of all RILs fitted using a system of ODEs (1).
Figure 2
Figure 2
Growth trajectories of leaf (A, D), stem (B, E) and root biomass (C, F) for two different genotypes (presented by solid and broken black curves) at a QTL detected on linkage group 12 (upper panel) and 24 (lower panel), respectively. Two genotypes at a QTL are the homozygote for the alleles inherited from Kefeng No.1 (solid) and the homozygote for the allele from Nannong 1138-2 (broken). Curves in grey are growth trajectories of 184 RILs.
Figure 3
Figure 3
Growth trajectories of whole-plant (red), leaf (green), stem (blue) and root biomass (black) for two different genotypes at a QTL detected on linkage group 12 (upper panel) and 24 (lower panel). Two genotypes at a QTL are the homozygote for the alleles inherited from Kefeng No.1 (A, C) and the homozygote for alleles inherited from Nannong 1138-2 (B, D).
Figure 4
Figure 4
Time-dependent percentages of leaf (green), stem (blue) and root biomass (thin black) for two different genotypes at a QTL detected on linkage group 12 (upper panel) and 24 (lower panel). Two genotypes at a QTL are the homozygote for the alleles inherited from Kefeng No.1 (A, D) and the homozygote for alleles from Nannong 1138-2 (B, C).

References

    1. Lee SH, van der Werf JHJ, Hayes BJ, Goddard ME, Visscher PM. Predicting unobserved phenotypes for complex traits from whole-genome SNP data. PLoS Genet. 2008;4(10):e1000231.. - PMC - PubMed
    1. Lynch M, Walsh B. Genetics and Analysis of Quantitative Traits. Sinauer Associates, Sunderland, MA; 1998.
    1. Lander ES, Botstein D. Mapping Mendelian factors underlying quantitative traits using RFLP linkage maps. Genetics. 1989;121:185–199. - PMC - PubMed
    1. Zeng ZB. Precision mapping of quantitative trait loci. Genetics. 1994;136:1457–1468. - PMC - PubMed
    1. Xu S, Atchley WR. A random model approach to interval mapping of quantitative genes. Genetics. 1995;141:1189–1197. - PMC - PubMed

Publication types

LinkOut - more resources