. 2011 Oct;23(10):1584-9.
doi: 10.1016/j.cellsig.2011.05.007. Epub 2011 May 15.

Function of the asparagine 74 residue of the inhibitory γ-subunit of retinal rod cGMP-phophodiesterase (PDE) in vivo

Affiliations

Function of the asparagine 74 residue of the inhibitory γ-subunit of retinal rod cGMP-phophodiesterase (PDE) in vivo

Stephen H Tsang et al. Cell Signal. 2011 Oct.

Abstract

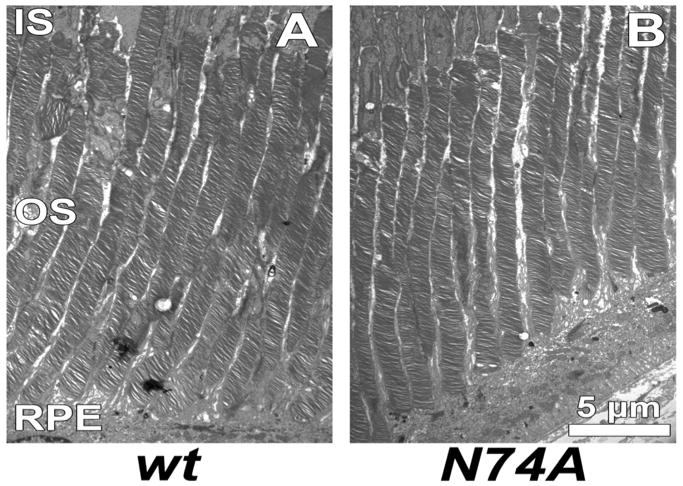
The inhibitory subunit of rod cyclic guanosine monophosphate (cGMP) phosphodiesterase, PDE6γ, is a major component of rod transduction and is required to support photoreceptor integrity. The N74A allele of PDE6γ has previously been shown in experiments carried out in vitro to reduce the regulatory inhibition on the PDE6 catalytic core subunits, PDE6αβ. This should, in intact rods, lead to an increase in basal (dark) PDE6 activity producing a state equivalent to light adaptation in the rods and we have examined this possibility using ERG and suction-electrode measurements. The murine opsin promoter was used to drive the expression of a mutant N74A and a wild-type PDE6γ control transgene in the photoreceptors of +/Pde6g(tm1) mice. This transgenic line was crossed with Pde6g(tm1)/Pde6g(tm1) mice to generate animals able to synthesize only the transgenic mutant PDE6γ. We find that the N74A mutation did not produce a significant decrease in circulating current, a decrease in sensitivity or affect the kinetics of the light response, all hallmarks of the light-adapted state. In an in vitro assay of the PDE purified from the N74A transgenic mice and control mice we could find no increase in basal activity of the mutant PDE6. Both the results from the physiology and the biochemistry experiments are consistent with the interpretation that the mutation causes a much milder phenotype in vivo than was predicted from observations made using a cell-free assay system. The in vivo regulation of PDE6γ on PDE6αβ may be more dynamic and context-dependent than was replicated in vitro.


Figures

Fig. 1
Fig. 1. Normal OS disc structure is seen in N74A mutant
(A) Electron photomicrographs of OS discs in a postnatal day 90-old wild type (wt) control. (B) Electron photomicrographs of OS discs in a a postnatal day 90-old Pde6gtml/Pde6gtml homozygote with the N74A transgene. (C) Mean OS lengths of wt controls and N74A determined from measurements made from transmission electron microscopy. The dimensions of rod outer segments were 25 μm from MF1 controls, and 22 μm from the N74A mutants. Error bar show standard deviation. Inner segment (IS), outer segment (OS), retinal pigment epithelium (RPE)
Fig. 2
Fig. 2. Expression of PDE6 and other rod proteins and measurement of PDE6 activity
(A) Immunoblot analysis of PDE6 subunits and transducin α-subunit (GNAT1) in retinal extracts of control MF1 (+/+), heterozygous +/Pde6gtml (+/-) and N74A on the Pde6gtml/Pde6gtml background. Protein was normalised to 50 μg unless otherwise stated. (B) Immunoblot analysis of guanylyl cyclase (GUCY2E), channel protein (CNGA1), rhodopsin kinase (GRK1), RGS9, α-transducin (GNAT1), and rhodopsin (RHO) with α-tubulin as a standard. Protein was normalised to 50 μg unless otherwise stated. (C) Quantitative analysis of PDE6 content from retinal homogenates. Signal intensities were determined by densitometry to calculate an IDV for each band. The values were normalised to the amount of protein loaded and expressed as a percentage relative to the PDE6 signal in 2.5 μg of control lysate. Similar normalized values were obtained at different loading amounts. (D) Basal (dark-adapted) PDE6 activity in P40 control and N74A retinal extracts were measured in control and N74A-mutant retinal extracts. Contrary to expectation, basal cGMP-PDE6 activity in N74A retinas was comparable to control retinas.
Fig. 3
Fig. 3. Electroretinogram (ERG) assessed global retinal function in the N74A mutants
Rod-specific (A) and maximal mixed rod-cone (B) responses, and photopic cone responses (C) in four-week old N74A and control mice. ERGs were measured with an Espion Stimulator and response curves were generated. a-wave, photoreceptor response; b-wave, bipolar response. To assess cone signaling, mice were light adapted (32 cd/m2 white light) in the Ganzfeld dome for twenty minutes. Then, ERGs were recorded with a series of flash intensities ranging from near threshold (0.8 cd s /m2) to four log units above at 2.1 Hz. A rod-suppressing steady background of 32 cd/m2 was continuously present. A total of 100 responses (filtered from 0.03 to 300 Hz) were averaged for each trial. Rod-specific (A), Maximal (B), and cone (C) wave peaks in N74A mice are comparable to the C57BL/6 controls.
Fig. 4
Fig. 4. Waveform and amplitude of WT and N74A rods
(A) Suction electrode recordings of N74A photoresponses. A) Strain-control rod responses to light flashes (20 ms) at seven intensities, 4, 17, 43, 158, 453, 1122 and 1870 photons μm-2. Traces are the averages from ten rods; each intensity averaged from 5-10 flashes. (B) N74A rod responses to the same seven intensities, averaged from 28 rods. (C) Intensity-response functions for dark-adapted (-■-) and light-adapted control strain (-□-) rods and dark-adapted (-●-) and light-adapted (-○-) N74A, N74A rods. Data are fit to Boltzmann equations, black control strain, red N74A. The control data is averaged from ten rods, N74A from 12 rods. The background light for the light-adapted rods was 440 photons μm-2 s-1 and flashes were delivered after 30 sec of background initiation. (D) Effect of light adaptation on response kinetics of N74A rods. Normalized flash responses to light of 453 photons μm-2 without a background light (black trace) or superimposed on background light of 13 (red), 38 (blue), 118 (green), 440 (magenta) or 1354 (gold) photons μm-2 s-1. Each trace is averaged from 12 rods, each rod sampled at each background intensity five times. Inset: Step-flash protocol with a saturating flash of 2433 photons μm-2 occurring without a background (black) or following 10 second exposure to backgrounds of 13 (red), 38 (blue), 118 (green), 440 (magenta) or 1354 (gold) photons μm-2 s-1. Traces are average of ten rods, and for each rod, each background was presented four times.

References

    1. Granovsky AE, Arte[Cowan, #1466]myev NO. Biochemistry. 2001;40(44):13209–13215. - PubMed
    1. Tsang SH, Gouras P. In: Duane’s Clinical Opthalmology. Tasman W, Jaeger EA, editors. Chapter 2 Philadelphia: J.B Lippincott; 1996.
    1. Farber DB, Tsang SH. Front Biosci. 2003;8:S666–675. - PubMed
    1. Qin N, Baehr W. J Biol Chem. 1994;269:3265–3271. - PubMed
    1. Muradov H, Boyd KK, Artemyev NO. Vision Res. 2004;44(21):2437–2444. - PubMed

Publication types

MeSH terms

LinkOut - more resources