. 2011 Jul 8;109(2):161-71.
doi: 10.1161/CIRCRESAHA.110.238717. Epub 2011 May 26.

Endogenous muscle atrophy F-box mediates pressure overload-induced cardiac hypertrophy through regulation of nuclear factor-kappaB

Affiliations

Endogenous muscle atrophy F-box mediates pressure overload-induced cardiac hypertrophy through regulation of nuclear factor-kappaB

Soichiro Usui et al. Circ Res. .

Abstract

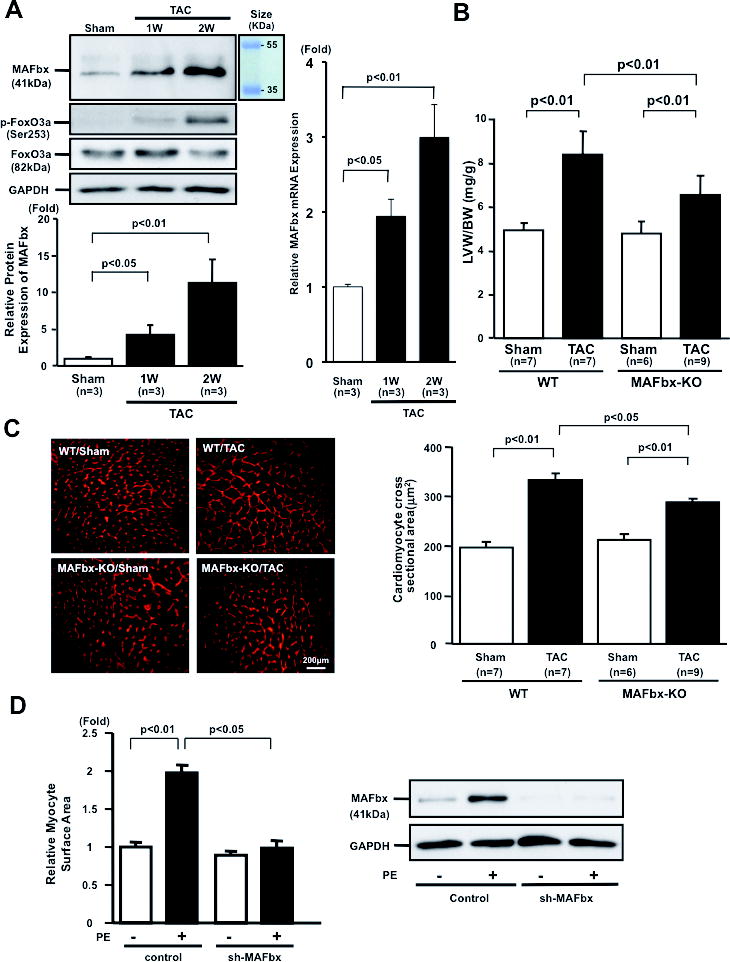
Rationale: Overexpression of muscle atrophy F-box (MAFbx/atrogin-1), an E3 ubiquitin ligase, induces proteasomal degradation in cardiomyocytes. The role of endogenous MAFbx in regulating cardiac hypertrophy and failure remains unclear.

Objective: We investigated the role of MAFbx in regulating cardiac hypertrophy and function in response to pressure overload. Transverse aortic constriction (TAC) was applied to MAFbx knockout (KO) and wild-type (WT) mice.

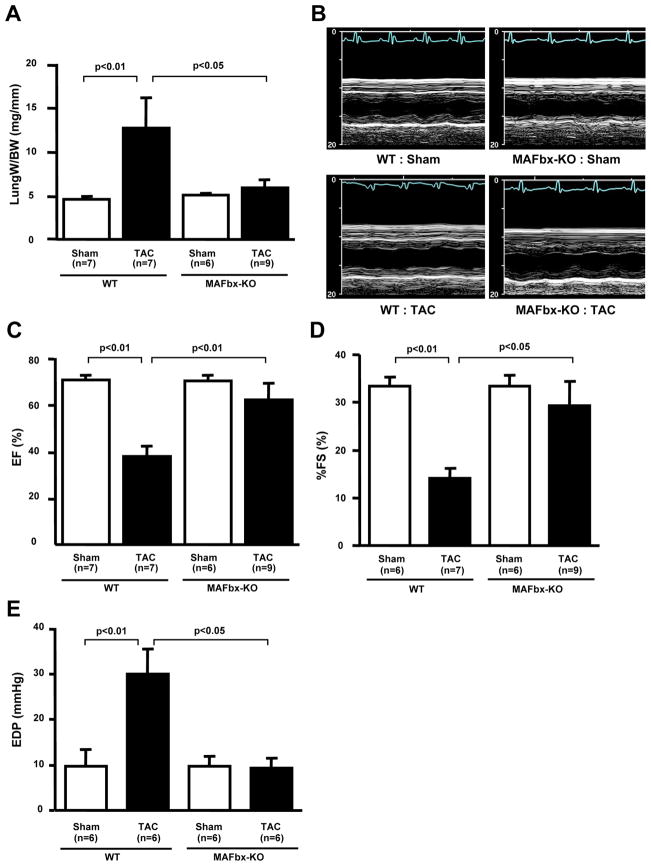
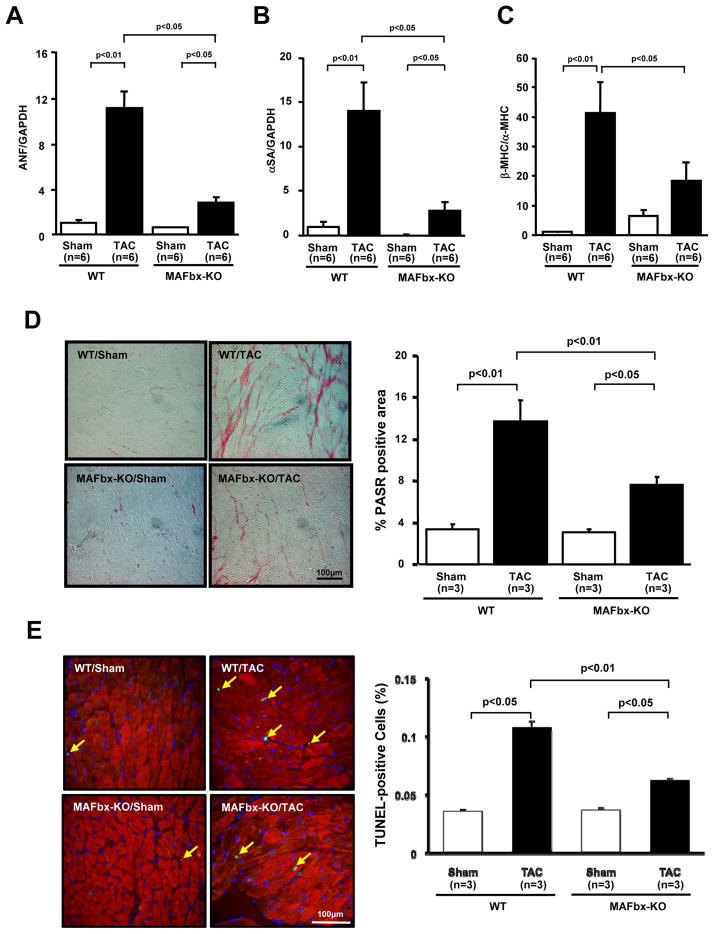
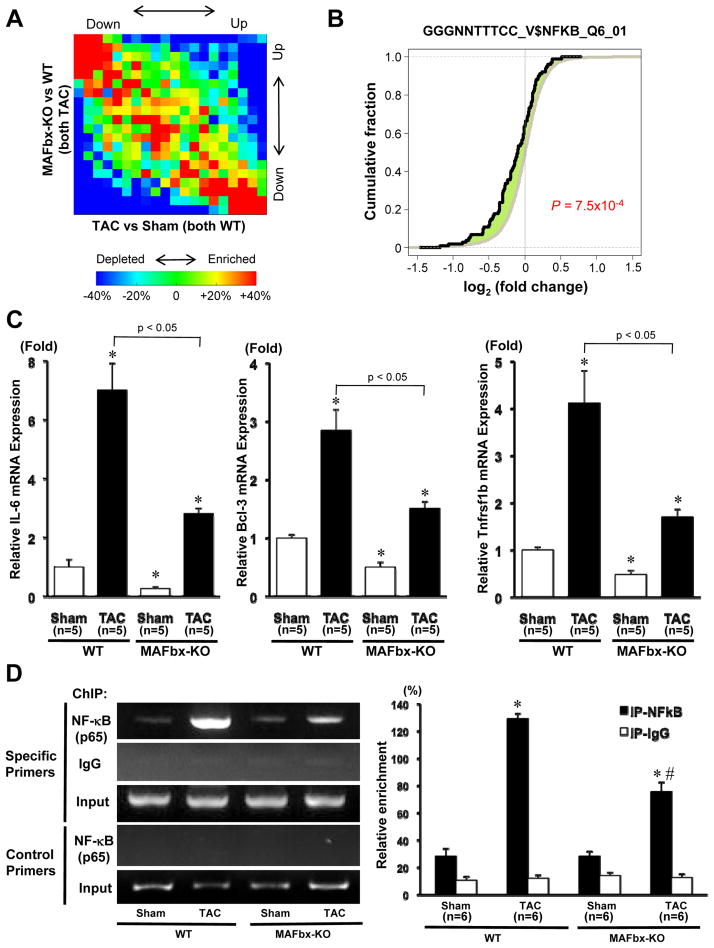
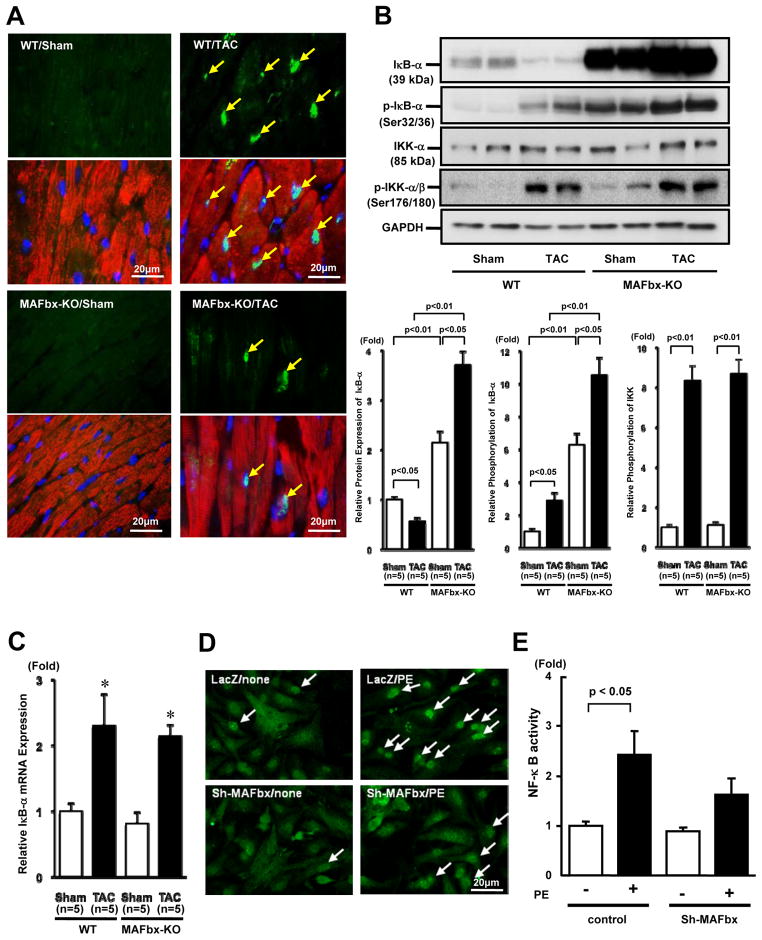
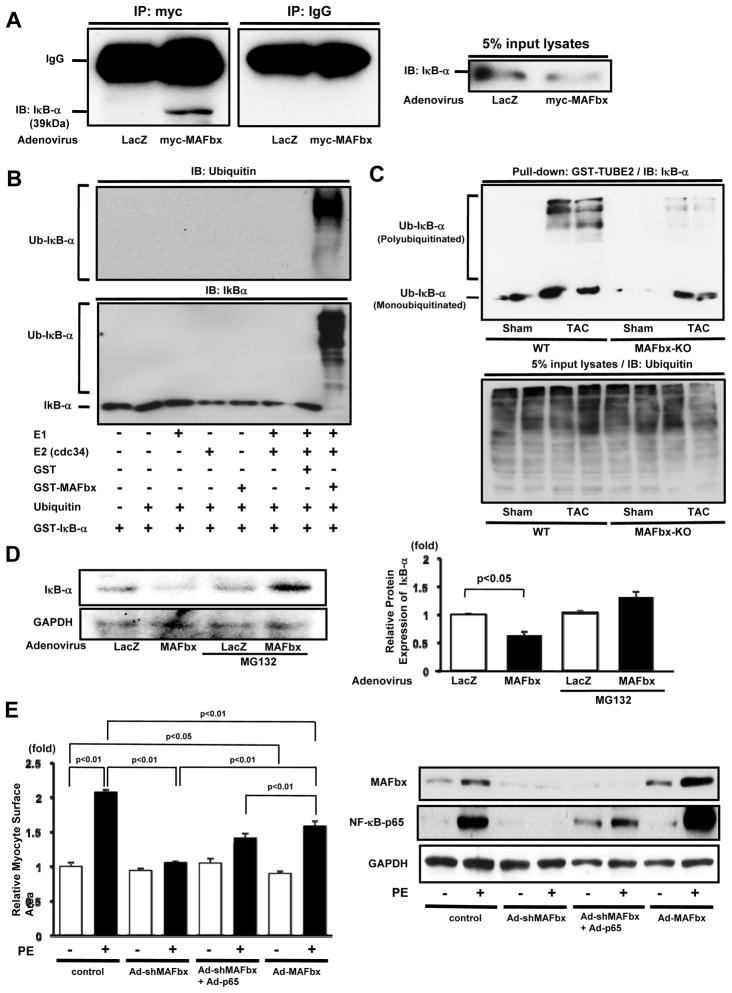
Methods and results: Expression of MAFbx in WT mice was significantly increased by TAC. TAC-induced increases in cardiac hypertrophy were significantly smaller in MAFbx KO than in WT mice. There was significantly less lung congestion and interstitial fibrosis in MAFbx KO than in WT mice. MAFbx KO also inhibited β-adrenergic cardiac hypertrophy. DNA microarray analysis revealed that activation of genes associated with the transcription factor binding site for the nuclear factor-κB family were inhibited in MAFbx KO mice compared with WT mice after TAC. Although the levels of IκB-α were significantly decreased after TAC in WT mice, they were increased in MAFbx KO mice. MAFbx regulates ubiquitination and proteasomal degradation of IκB-α in cardiomyocytes. In primary cultured rat cardiomyocytes, phenylephrine-induced activation of nuclear factor-κB and hypertrophy were significantly suppressed by MAFbx knockdown but were partially rescued by overexpression of nuclear factor-κB p65.

Conclusions: MAFbx plays an essential role in mediating cardiac hypertrophy in response to pressure overload. Downregulation of MAFbx inhibits cardiac hypertrophy in part through stabilization of IκB-α and inactivation of nuclear factor-κB. Taken together, inhibition of MAFbx attenuates pathological hypertrophy, thereby protecting the heart from progression into heart failure.


Figures

Figure 1
Figure 1. Deletion of MAFbx inhibits PO-induced cardiac hypertrophy
A, Expression of MAFbx, Foxo3a, and phosphorylated Foxo3a in mouse hearts in response to TAC. TAC (1 and 2 weeks) or sham operation was performed on C57/BL6 mice. Protein expression of MAFbx and GAPDH was determined by immunoblotting (left upper panels). The results of the quantitative analysis of MAFbx expression are also shown (left lower panel). mRNA expression of MAFbx gene was determined by quantitative RT-PCR (right panel). B and C, MAFbx KO mice were subjected to TAC or sham operation for 2 weeks. B, Left ventricular weight (LVW)/body weight (BW) after TAC is shown. C, LV cardiomyocyte cross sectional area is shown. Representative pictures of wheat germ agglutinin staining (left panels) and a bar graph showing the results of quantitative analysis (right panel). D, The effect of MAFbx knock-down on phenylephrine (PE)-induced cardiac hypertrophy. Myocytes were transduced with Ad-sh-MAFbx or control adenovirus and stimulated with PE (10 μmol/L) for 48 hours (left panel). Mean myocyte surface area was obtained from 250 myocytes/well. Protein expression of MAFbx and GAPDH was determined by immunoblotting (right panels).
Figure 2
Figure 2. Deletion of MAFbx inhibits PO-induced cardiac dysfunction
A, Lung weight/BW after TAC for 4 weeks is shown. B–D, LV systolic function was evaluated by echocardiographic measurement. Representative M-mode tracings are shown in B. C, LV ejection fraction (LVEF). D, fractional shortening (%FS). E, LV end-diastolic pressure (EDP) was obtained by hemodynamic measurement.
Figure 3
Figure 3. Genetic deletion of MAFbx inhibits TAC-induced cardiac hypertrophy
A, B, and C, mRNA expression of fetal type genes associated with cardiac hypertrophy was determined by quantitative RT-PCR. Atrial natriuretic factor (ANF) (A). α-skeletal actin (αSA) (B). β-MHC/α-MHC (C). D, Picric acid sirius red (PASR) staining of cardiac sections (left). Percentage of PASR positive areas (right). E, Representative images of TUNEL staining of cardiac sections two weeks after TAC counterstained with anti-troponin T antibody (left). Percent TUNEL-positive myocytes (right).
Figure 4
Figure 4. Inverse correlation of gene expression profile between MAFbx KO and WT mice after TAC
A, Gene density plot of the gene expression profiles for comparison. The x-axis is the difference in gene expression between WT sham and WT TAC, and the y-axis is the difference between WT TAC and MAFbx KO TAC. The observed gene density values were normalized to expected values derived from randomized data and plotted in a heat map to represent gene enrichment or depletion. Red indicates gene enrichment and blue gene depletion. The negative correlation is also indicated by Spearman rank correlation (r = −0.39, p < 2.2×10⁻¹⁶). B, Genes associated with the binding site of the NF-κB family were significantly downregulated in MAFbx KO mice after TAC. X-axis indicates log2 (fold change) in MAFbx KO vs. WT after TAC. The black line is for genes associated with the binding site of the NF-κB family (GGGNNTTTCC_V$NFKB_Q6_01), and the gray one is for other genes. The leftward shift of the black line indicates more downregulation compared with the gray one. The P-value was based on the comparison of black and gray lines using the Kolmogorov-Smirnov (KS) test. C, Expression of genes of IL-6, Bcl-3, and Tnfrsf1b was determined by quantitative RT-PCR. D, Left panels: ChIP assay with antibody against NFκB-p65. A parallel ChIP assay was performed with rabbit IgG as a ChIP assay control. DNA was amplified and quantitated by PCR with specific primers flanking the mouse IL-6 gene promoter containing the NF-κB-binding motif (Online Fig. IV) and a pair of control primers that does not contain the NF-κB-binding motif. PCR using input DNA as template serves as an internal control. Right panel: Quantitative analysis of the data shown in left panels. Results are expressed as ratios of immunoprecipitated vs. input DNA. *p < 0.05 vs. WT-Sham, #p < 0.05 vs. WT-TAC.
Figure 5
Figure 5. Deletion of MAFbx inhibits NF-κB activationin vivo andin vitro
A-C, MAFbx-KO and WT mice were subjected to TAC or sham operation for 2 weeks. A, Myocardial sections were stained with anti-NF-κB-p65 antibody (green), anti-troponin (T antibody (red) and DAPI (blue). Arrows indicate nuclear localization of NF-κB. B, The expression levels of IκB-α, phosphorylated IκB-α, IκB kinase-α (IKK-α) and phosphorylated IKK were determined by immunoblotting (upper panels). The results of the quantitative analysis of IκB-α, phosphorylated IκB-α, phosphorylated IKK (lower panels). C, Expression of IκB-α gene was determined by quantitative RT-PCR. D, The nuclear translocation of NF-κB was evaluated with immunostaining. Myocytes were transduced with either Ad-LacZ or Ad-shRNA-MAFbx and stimulated with PE for 48 hours. E, The effect of MAFbx knock-down on PE-induced NF-κB activation. Myocytes were transfected with NF-κB/luciferase reporter together with either control plasmid or pDC311-sh-MAFbx. Myocytes were stimulated with PE for 48 hours.
Figure 6
Figure 6. MAFbx induces proteasomal degradation of IkB, thereby inducing cardiac hypertrophy
A, Lysates from cardiomyocytes transduced with Ad-myc-MAFbx or Ad-LacZ were subjected to immunoprecipitation with anti-myc or control IgG. The immunoprecipitates were immunoblotted with anti-IκBα antibody. The left panel shows an immunoblot of the input with anti-IκB-α antibody. B, In vitro ubiquitination reactions were performed with indicated materials. IκB-α is ubiquitinated by MAFbx as demonstrated with immunoblot analyses with anti-ubiquitin (upper panel) and anti-IκB-α antibodies (lower panel). C, Heart homogenates (500 μg) were incubated with 20 μg of GST-TUBE2 to obtain ubiquitinated proteins. The samples were subjected to immunoblot with anti-IκB-α antibody. The lower panel shows an immunoblot of the input with anti-ubiquitin antibody. D, Myocytes were transduced with Ad-MAFbx or Ad-LacZ and pretreated with or without MG132. Cell lysates were subjected to immunoblot using anti-IκB-α antibody. E, Myocytes were transduced with Ad-sh-MAFbx, Ad-p65 or Ad-MAFbx alone or in combination and stimulated with PE for 48 hours. Myocyte surface area was obtained from 250 myocytes/well. Right panel shows expression of MAFbx, NF-κB-p65 and GAPDH. The results are from 4–5 experiments.

Comment in

References

    1. Morisco C, Sadoshima J, Trimarco B, Arora R, Vatner DE, Vatner SF. Is treating cardiac hypertrophy salutary or detrimental: the two faces of Janus. Am J Physiol (Heart Circ Physiol) 2003;284:H1043–H1047. - PubMed
    1. Levy D, Garrison RJ, Savage DD, Kannel WB, Castelli WP. Prognostic implications of echocardiographically determined left ventricular mass in the Framingham Heart Study. N Engl J Med. 1990;322:1561–1566. - PubMed
    1. Dorn GW, 2nd, Force T. Protein kinase cascades in the regulation of cardiac hypertrophy. J Clin Invest. 2005;115:527–537. - PMC - PubMed
    1. Heineke J, Molkentin JD. Regulation of cardiac hypertrophy by intracellular signalling pathways. Nat Rev Mol Cell Biol. 2006;7:589–600. - PubMed
    1. Wang X, Robbins J. Heart failure and protein quality control. Circ Res. 2006;99:1315–1328. - PubMed

Publication types

MeSH terms