. 2011 Aug;31(8):1796-804.
doi: 10.1161/ATVBAHA.111.228924. Epub 2011 May 26.

Knockout of toll-like receptor-2 attenuates both the proinflammatory state of diabetes and incipient diabetic nephropathy

Affiliations

Knockout of toll-like receptor-2 attenuates both the proinflammatory state of diabetes and incipient diabetic nephropathy

Sridevi Devaraj et al. Arterioscler Thromb Vasc Biol. 2011 Aug.

Abstract

Objective: Type 1 diabetes (T1DM) is a proinflammatory state and confers an increased risk for vascular complications. Toll-like receptors (TLR) could participate in diabetic vasculopathies. Whether TLR activation contributes to the proinflammatory state of T1DM and the pathogenesis of diabetic nephropathy remains unknown.

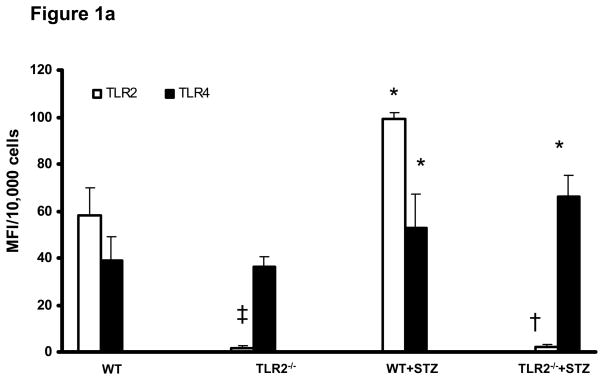
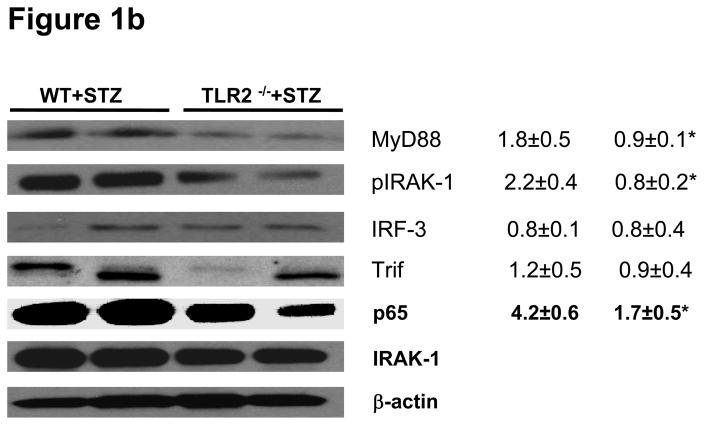
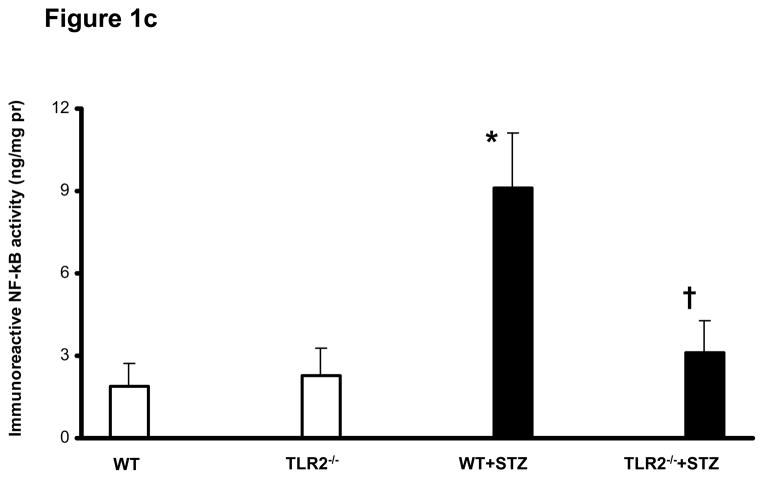
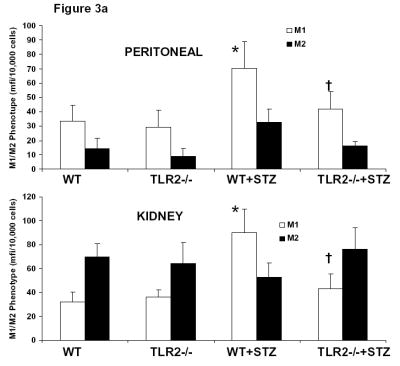
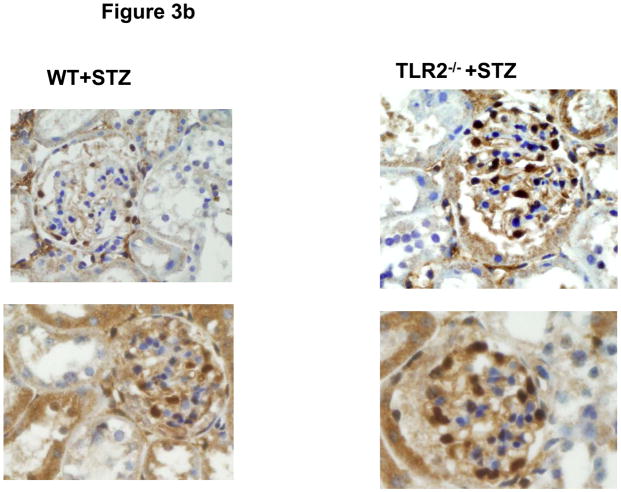
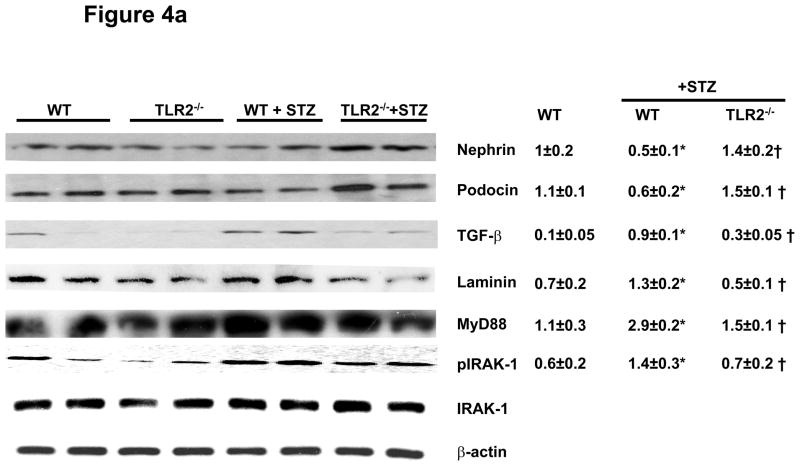
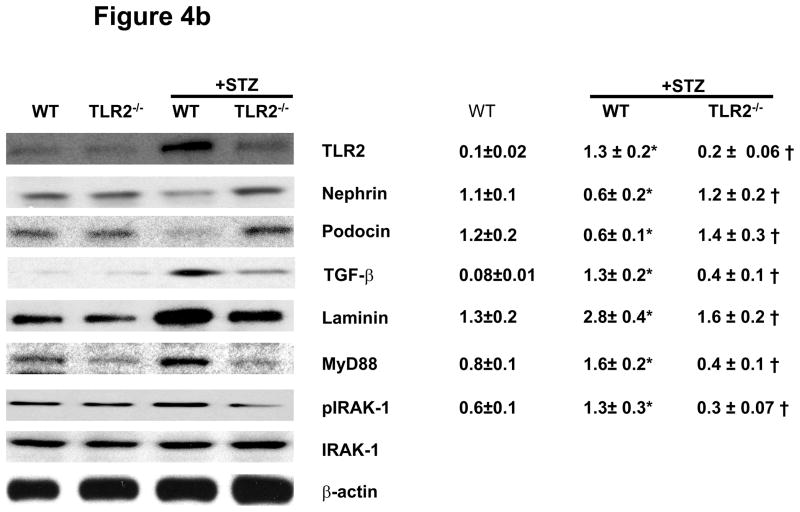
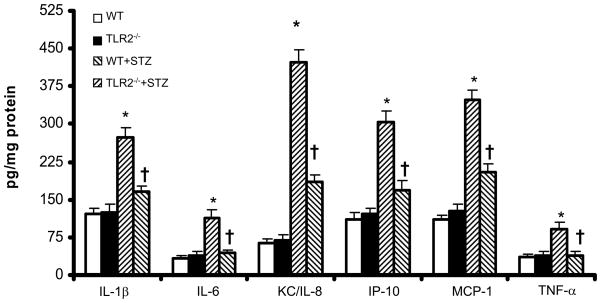
Methods and results: We induced T1DM in TLR2 knockout mice (TLR2-/-) and wild-type littermates (C57BL/6J-WT) using streptozotocin (STZ). Fasting blood, peritoneal macrophages, and kidneys were obtained for flow cytometry, Western blot, microscopy, and cytokine assays at 6 and 14 weeks after induction of diabetes. Macrophage TLR2 expression and MyD88-dependent signaling were increased in diabetic mice (WT+STZ) compared with nondiabetic WT mice. These biomarkers were attenuated in diabetic TLR2-/- macrophages. WT+STZ mice showed increased kidney:body weight ratio due to cell hypertrophy, increased albuminuria, decreased kidney nephrin, podocin, and podocyte number and increased transforming growth factor-β and laminin compared with WT mice. Nephrin, podocin, and podocyte number and effacement were restored, and transforming growth factor-β and laminin levels were decreased in TLR2-/-+ STZ mice kidneys versus WT+STZ. Peritoneal and kidney macrophages were predominantly M1 phenotype in WT+STZ mice; this was attenuated in TLR2-/-+STZ mice.

Conclusions: These data support a role for TLR2 in promoting inflammation and early changes of incipient diabetic nephropathy, in addition to albuminuria and podocyte loss.


Figures

Figure 1
Figure 1
Figure 1a: Surface expression of TLR2 and TLR4: Peritoneal macrophages were obtained from WT (n=5), TLR2−/− (n=5), WT+STZ (n=20) and TLR2−/−+STZ (n=22) mice at 6 weeks and surface expression of TLR2 and TLR4 were assessed by flow cytometry as described in Methods. Values are expressed as MFI/10,000 cells (mean ± SD). *P<0.001 vs WT and TLR2−/−; †P<0.001 vs WT or WT+STZ; ‡P<0.05 vs WT. Figure 1b: TLR2-MyD88 dependent signaling: MyD88, IRAK-1 phosphorylation, IRF3, Trif, and nuclear p65 protein levels were measured in peritoneal macrophage lysates from WT+STZ (n=20) and TLR2−/−+STZ mice (n=22) at 6 weeks using Western lot assay. Representative blots with densitometric ratios were depicted in the figure. Values are expressed as protein/β-actin ratio (mean± SD). *P<0.001 vs WT+STZ mice. Total IRAK-1 and β-actin were used as internal controls. Figure 1c: Nuclear NF-kB activation in peritoneal macrophages of WT (n=5), TLR2−/− (n=5), WT+STZ (n=20) and TLR2−/−+STZ (n=22) mice at six weeks was determined by Trans-AM activity assay and normalized to nuclear protein as described in Methods. Values are expressed as ng/mg protein (mean ± SD). *P<0.005 vs WT and TLR2−/−; †P<0.001 vs WT+STZ mice.
Figure 1
Figure 1
Figure 1a: Surface expression of TLR2 and TLR4: Peritoneal macrophages were obtained from WT (n=5), TLR2−/− (n=5), WT+STZ (n=20) and TLR2−/−+STZ (n=22) mice at 6 weeks and surface expression of TLR2 and TLR4 were assessed by flow cytometry as described in Methods. Values are expressed as MFI/10,000 cells (mean ± SD). *P<0.001 vs WT and TLR2−/−; †P<0.001 vs WT or WT+STZ; ‡P<0.05 vs WT. Figure 1b: TLR2-MyD88 dependent signaling: MyD88, IRAK-1 phosphorylation, IRF3, Trif, and nuclear p65 protein levels were measured in peritoneal macrophage lysates from WT+STZ (n=20) and TLR2−/−+STZ mice (n=22) at 6 weeks using Western lot assay. Representative blots with densitometric ratios were depicted in the figure. Values are expressed as protein/β-actin ratio (mean± SD). *P<0.001 vs WT+STZ mice. Total IRAK-1 and β-actin were used as internal controls. Figure 1c: Nuclear NF-kB activation in peritoneal macrophages of WT (n=5), TLR2−/− (n=5), WT+STZ (n=20) and TLR2−/−+STZ (n=22) mice at six weeks was determined by Trans-AM activity assay and normalized to nuclear protein as described in Methods. Values are expressed as ng/mg protein (mean ± SD). *P<0.005 vs WT and TLR2−/−; †P<0.001 vs WT+STZ mice.
Figure 2
Figure 2
Circulating levels of pro-inflammatory cytokines and chemokines in sera of WT (n=5), TLR2−/− (n=5), WT+STZ (n=20) and TLR2−/−+STZ (n=22) mice at 6 weeks were examined by multiplex assays as described in Methods. Values are expressed as pg/ml (mean ± SD). *P<0.001 vs WT and TLR2−/−; †P<0.001 vs to WT or WT+STZ.
Figure 3
Figure 3
Figure 3a: Phenotype of Peritoneal (Upper Panel) and Kidney (Lower Panel) Macrophages were assessed by flow cytometry as described in Methods. M1 Phenotype was characterized by positivity for Ly6C, CCR2 and IL-6 while M2 phenotype was characterized by CD206 and CD 163.. *P<0.001 vs WT and TLR2−/−; †P<0.001 vs. WT or WT+STZ. Figure 3b: Podocytes in glomeruli of diabetic wild type (WT) and TLR2−/− mice kidneys at 14 weeks were examined by WT-1 immunochemical staining as described in methods (n=11/group). 2 Representative photographs of WT-1 staining (brown spots in glomeruli) are shown for the 2 groups.
Figure 3
Figure 3
Figure 3a: Phenotype of Peritoneal (Upper Panel) and Kidney (Lower Panel) Macrophages were assessed by flow cytometry as described in Methods. M1 Phenotype was characterized by positivity for Ly6C, CCR2 and IL-6 while M2 phenotype was characterized by CD206 and CD 163.. *P<0.001 vs WT and TLR2−/−; †P<0.001 vs. WT or WT+STZ. Figure 3b: Podocytes in glomeruli of diabetic wild type (WT) and TLR2−/− mice kidneys at 14 weeks were examined by WT-1 immunochemical staining as described in methods (n=11/group). 2 Representative photographs of WT-1 staining (brown spots in glomeruli) are shown for the 2 groups.
Figure 4
Figure 4
Figure 4a: Slit diaphragm proteins Nephrin, Podocin and Extracellular matrix (ECM) proteins TGF-β, Laminin, MyD88, and IRAK-1 phosphorylation in kidney lysates of WT (n=5), TLR2−/− (n=5), WT+STZ (n=14) and TLR2−/−+STZ (n=16) at 6 weeks after diabetes were determined using Western blot. Representative blots with densitometric ratios were shown in the figure. Total IRAK-1 and β-actin were used as internal controls. Values are expressed as protein/β-actin ratio (mean ± SD). *P<0.005 vs WT; †P<0.02 vs WT+STZ. Figure 4b: TLR2, Nephrin, Podocin, TGF-β, Laminin, MyD88, and IRAK-1 phosphorylation in kidney lysates of WT, TLR2−/−, WT+STZ, and TLR2−/−+STZ (n=11/gr) at 14 weeks after diabetes were measured in kidney tissue lysates using Western blot assay. Representative blots with densitometric ratios were depicted in the figure. Total IRAK-1 and β-actin were used as internal controls. Values are expressed as protein/β-actin ratio (mean ± SD). *P<0.001 vs WT mice. †P<0.05 vs WT+STZ.
Figure 4
Figure 4
Figure 4a: Slit diaphragm proteins Nephrin, Podocin and Extracellular matrix (ECM) proteins TGF-β, Laminin, MyD88, and IRAK-1 phosphorylation in kidney lysates of WT (n=5), TLR2−/− (n=5), WT+STZ (n=14) and TLR2−/−+STZ (n=16) at 6 weeks after diabetes were determined using Western blot. Representative blots with densitometric ratios were shown in the figure. Total IRAK-1 and β-actin were used as internal controls. Values are expressed as protein/β-actin ratio (mean ± SD). *P<0.005 vs WT; †P<0.02 vs WT+STZ. Figure 4b: TLR2, Nephrin, Podocin, TGF-β, Laminin, MyD88, and IRAK-1 phosphorylation in kidney lysates of WT, TLR2−/−, WT+STZ, and TLR2−/−+STZ (n=11/gr) at 14 weeks after diabetes were measured in kidney tissue lysates using Western blot assay. Representative blots with densitometric ratios were depicted in the figure. Total IRAK-1 and β-actin were used as internal controls. Values are expressed as protein/β-actin ratio (mean ± SD). *P<0.001 vs WT mice. †P<0.05 vs WT+STZ.
Figure 5
Figure 5
Cytokine and chemokine concentrations in the kidney lysates of WT, TLR2−/−, WT+STZ and TLR2−/−+STZ mice (n=11/gr) was measured by Multiplex assay as described in Methods at 14 weeks. Values are expressed as pg/mg cell protein (mean ± SD). *P<0.001 vs WT and TLR2−/−; †P<0.01 vs WT+STZ.

References

    1. Libby P, Nathan DM, Abraham K, Brunzell JD, Fradkin JE, Haffner SM, Hsueh W, Rewers M, Roberts BT, Savage PJ, Skarlatos S, Wassef M, Rabadan-Diehl C. National Heart, Lung, and Blood Institute; National Institute of Diabetes and Digestive and Kidney Diseases Working Group on Cardiovascular Complications of Type 1 Diabetes Mellitus. Report of the National Heart, Lung, and Blood Institute-National Institute of Diabetes and Digestive and Kidney Diseases Working Group on Cardiovascular Complications of Type 1 Diabetes Mellitus. Circulation. 2005;111:3489–3493. - PubMed
    1. Devaraj S, Glaser N, Griffen S, Wang-Polagruto J, Miguelino E, Jialal I. Increased monocytic activity and biomarkers of inflammation in patients with type 1 diabetes. Diabetes. 2006;55:774–779. - PubMed
    1. Devaraj S, Dasu MR, Jialal I. Diabetes is a proinflammatory state: a translational perspective. Expert Rev Endocrinol Metab. 2010;5(1):19–28. - PMC - PubMed
    1. Schram MT, Chaturvedi N, Schalkwijk CG, Fuller JH, Stehouwer CD EURODIAB Prospective Complications Study Group. Markers of inflammation are cross-sectionally associated with microvascular complications and cardiovascular disease in type 1 diabetes--the EURODIAB Prospective Complications Study. Diabetologia. 2005;48:370–378. - PubMed
    1. Schalkwijk CG, Poland DC, van Dijk W, Kok A, Emeis JJ, Dräger AM, Doni A, van Hinsbergh VW, Stehouwer CD. Plasma concentration of C-reactive protein is increased in type I diabetic patients without clinical macroangiopathy and correlates with markers of endothelial dysfunction: evidence for chronic inflammation. Diabetologia. 1999;42:351–357. - PubMed

Publication types

MeSH terms