. 2011 Dec 15;519(18):3672-83.
doi: 10.1002/cne.22675.

Segregation of feedforward and feedback projections in mouse visual cortex

Affiliations

Segregation of feedforward and feedback projections in mouse visual cortex

Vladimir K Berezovskii et al. J Comp Neurol. .

Abstract

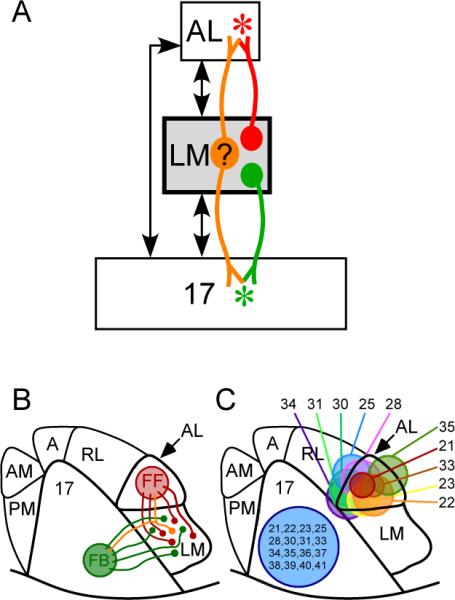
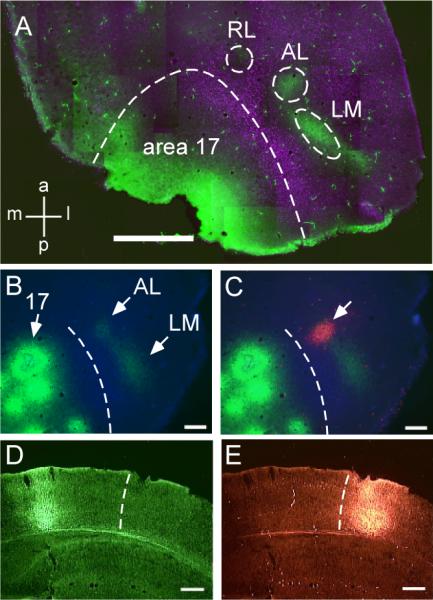
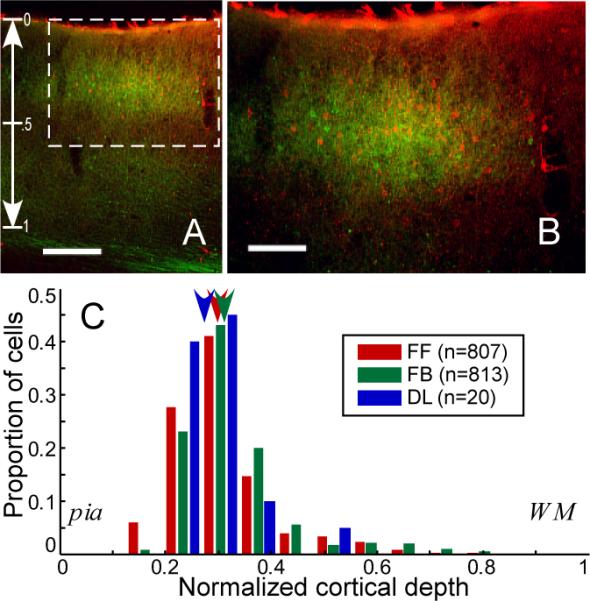
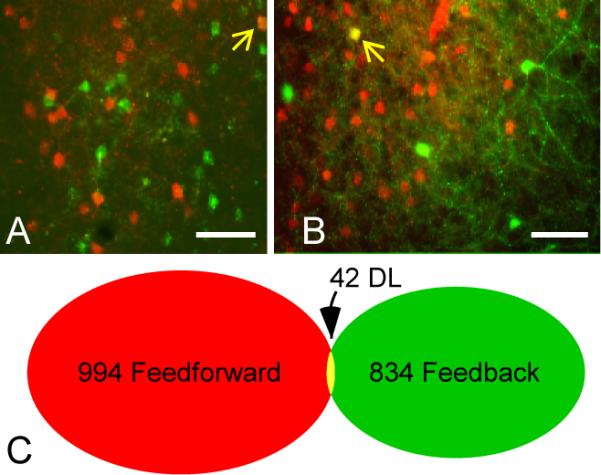
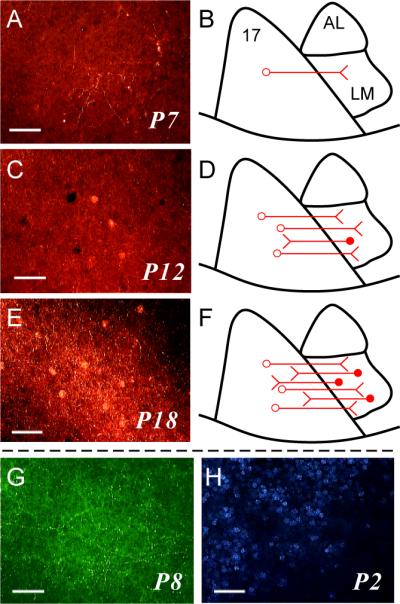
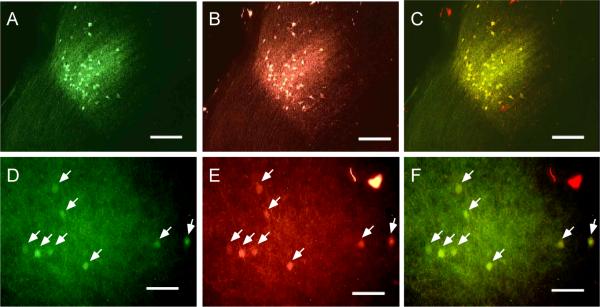
Hierarchical organization is a common feature of mammalian neocortex. Neurons that send their axons from lower to higher areas of the hierarchy are referred to as "feedforward" (FF) neurons, whereas those projecting in the opposite direction are called "feedback" (FB) neurons. Anatomical, functional, and theoretical studies suggest that these different classes of projections play fundamentally different roles in perception. In primates, laminar differences in projection patterns often distinguish the two projection streams. In rodents, however, these differences are less clear, despite an established hierarchy of visual areas. Thus the rodent provides a strong test of the hypothesis that FF and FB neurons form distinct populations. We tested this hypothesis by injecting retrograde tracers into two different hierarchical levels of mouse visual cortex (area 17 and anterolateral area [AL]) and then determining the relative proportions of double-labeled FF and FB neurons in an area intermediate to them (lateromedial area [LM]). Despite finding singly labeled neurons densely intermingled with no laminar segregation, we found few double-labeled neurons (≈5% of each singly labeled population). We also examined the development of FF and FB connections. FF connections were present at the earliest timepoint we examined (postnatal day 2, P2), while FB connections were not detectable until P11. Our findings indicate that, even in cortices without laminar segregation of FF and FB neurons, the two projection systems are largely distinct at the neuronal level and also differ with respect to the timing of their axonal outgrowth.


Figures

Figure 1
Figure 1
Rodent visual cortical hierarchy and experimental design. A: Hierarchical organization of the three visual areas of the rodent cortex relevant to this study (modified from figure 15 in Coogan & Burkhalter 1993) showing the general logic of the experiment. Injections of retrograde tracers were made in AL (red asterisk) and area 17 (green asterisk), and the relative numbers of singly and doubly labeled neurons were determined in LM. B: Topographical arrangement of visual areas in the mouse showing the locations of tracer injections. C: Locations of tracer injections in individual cases. Each number represents a single mouse and the colored circles in AL represent the outer margins of the tracer injections in each animal.
Figure 2
Figure 2
Successful injections targeted to areas 17 and AL. A: Montage of a tangential section of flattened cortex showing layout of relevant visual areas. The magenta label is bis-benzimide transport from contralateral injections and represents borders between some visual areas. Green patches in areas AL and LM are anterograde transport resulting from the area 17 injections. B, C: Location of injection sites in areas 17 and AL for case #28. B: Anterograde mapping of AL and LM after injection of BDA into area 17. The border separating area 17 from areas AL and LM is identified by the band of blue bis-benzimide labeled callosal projection neurons (dashed line). C: Same section as in panel B showing location of injection of DA-594 into AL (arrow). D, E: Coronal sections from case #37 showing injections of BDA in area 17 (D) and DA-594 in area AL (E). The injections span all layers of the cortex. The dashed line indicates the anteromedial limit of the band of callosal connections that separates area 17 from areas AL and LM. Scale bars: 1 mm in A, 250 μm in B–E. A magenta-green version of this figure is available as Supplementary Figure 1.
Figure 3
Figure 3
Laminar overlap of feedforward and feedback neurons in area LM. A: Coronal section through LM from case #36 reveals the intermingling of feedforward (FF, red) and feedback (FB, green) neurons largely confined to the supragranular layers of the cortex. Vertical scale on left indicates normalized cortical depth used for histogram in panel C. In this particular section, counterstaining with thionin revealed that the bottom of layer 3 corresponded to a normalized cortical depth of 0.5 and the top of layer 5 corresponded to a normalized cortical depth of 0.69. B: Higher power view of the rectangular region in panel A. C: Histogram of depth profiles of all retrogradely labeled neurons in LM. The arrowheads represent the median for each group. Scale bars: 200 μm in A and 100 μm in B. A magenta-green version of this figure is available as Supplementary Figure 2.
Figure 4
Figure 4
Distinct populations of feedforward and feedback neurons in area LM. A, B: Tangential sections at an approximate depth of 200 μm through LM from cases #21 (A) and #22 (B) showing FF (red) and FB (green) neurons. In each panel, a single double-labeled neuron is indicated by the yellow arrow. C: Venn diagram showing minimal overlap in the populations of FF and FB neurons as evidenced by the paucity of double-labeled neurons. Cell counts are totals from seven different experiments (table 1) after correcting for sectioning bias. Scale bars: 50 μm in A and B. Two small artifacts produced by autofluorescent debris were eliminated from panel A using the “Clone Stamp Tool” in Adobe Photoshop. A magenta-green version of this figure is available as Supplementary Figure 3.
Figure 5
Figure 5
Development of feedforward and feedback connections between area 17 and area LM. A, C, E: Tangential sections through area LM after injections of DA-594 into area 17 at different postnatal days. B, D, F: Schematics summarizing the labeling pattern observed across cases at each time point. A,B: postnatal day 7 (P7). C,D: P12. E,F: P18. Anterograde label is present in all sections, indicating the presence of FF connections, but retrogradely labeled cell bodies (FB neurons) are present only at P12 and P18. G: Tangential section through area LM showing clear anterograde labeling and absence of retrograde labeling after an injection of BDA into area 17 at P8. H: Tangential section through region on border of LM showing callosally projecting neurons retrogradely labeled after an injection of bis-benzimide into the contralateral hemisphere at P2. Scale bars: 50 μm in all panels.
Figure 6
Figure 6
Labeling efficiency of retrograde tracers. A–C: Labeled neurons in the LGN after combined injection of both tracers (BDA, DA-594) into area 17. A: LGN neurons labeled with BDA. B: LGN neurons labeled with DA-594. C: Overlay of panels A and B showing that all neurons were double-labeled. D–F: Labeled neurons (arrows) in area LM after combined injection of both tracers (BDA, DA-594) into area 17. D: LM neurons labeled with BDA. E: LM neurons labeled with DA-594. F: Overlay of panels D and E showing that all neurons were double-labeled. Scale bars: 100 μm in A–C, 50 μm in D–F.

References

    1. Anderson JC, Martin KA. Synaptic connection from cortical area V4 to V2 in macaque monkey. J. Comp. Neurol. 2006;495:709–21. - PubMed
    1. Bai WZ, Ishida M, Arimatsu Y. Chemically defined feedback connections from infragranular layers of sensory association cortices in the rat. Neuroscience. 2004;123:257–67. - PubMed
    1. Barone P, Batardière A, Knoblauch K, Kennedy H. Laminar distribution of neurons in extrastriate areas projecting to visual areas area 17 and V4 correlates with the hierarchical rank and indicates the operation of a distance rule. J Neurosci. 2000;20:3263–81. - PMC - PubMed
    1. Barone P, Dehay C, Berland M, Bullier J, Kennedy H. Developmental remodeling of primate visual cortical pathways. Cereb Cortex. 1995;5:22–38. - PubMed
    1. Batardière A, Barone P, Knoblauch K, Giroud P, Berland M, Dumas AM, Kennedy H. Early specification of the hierarchical organization of visual cortical areas in the macaque monkey. Cereb Cortex. 2002;12:453–65. - PubMed

Publication types