. 2011 Jun 23;115(24):7950-62.
doi: 10.1021/jp201217b. Epub 2011 May 27.

Paradynamics: an effective and reliable model for ab initio QM/MM free-energy calculations and related tasks

Affiliations

Paradynamics: an effective and reliable model for ab initio QM/MM free-energy calculations and related tasks

Nikolay V Plotnikov et al. J Phys Chem B. .

Abstract

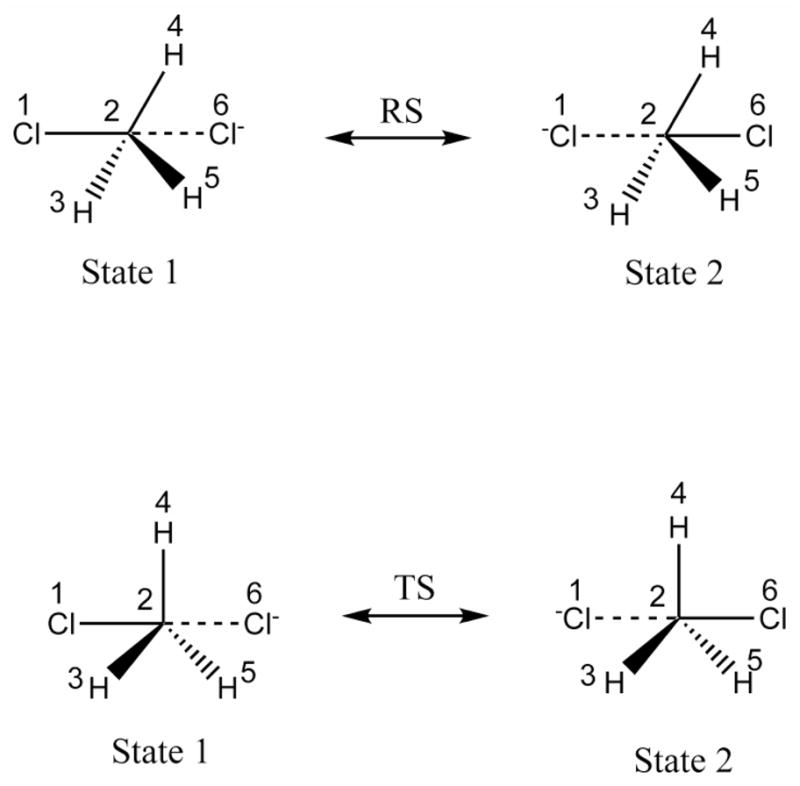
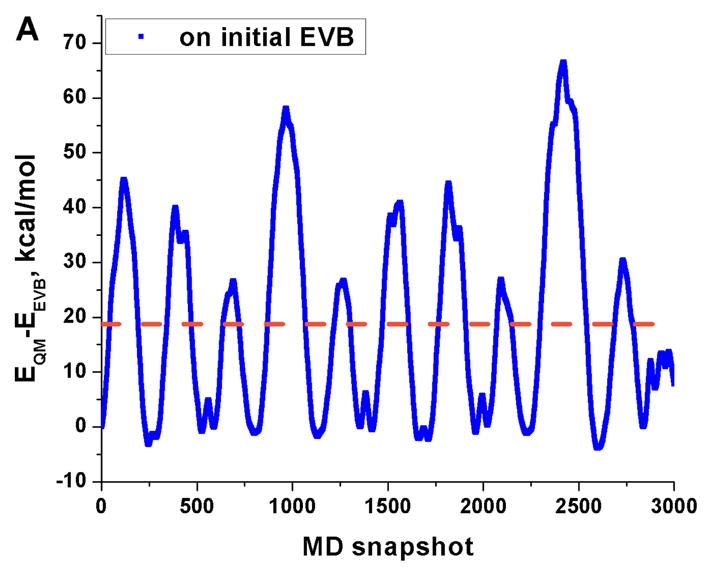
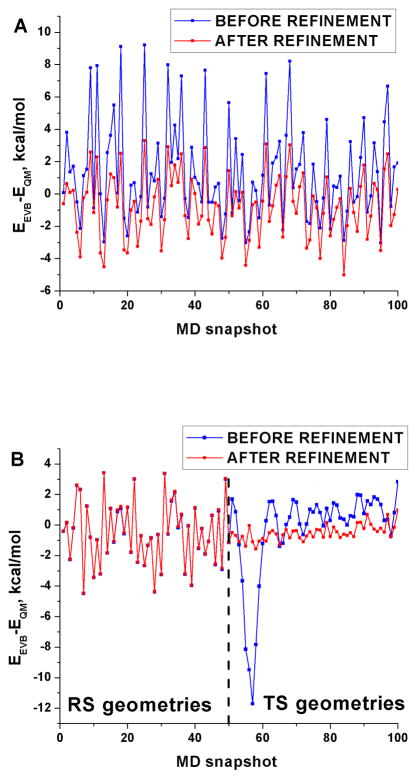
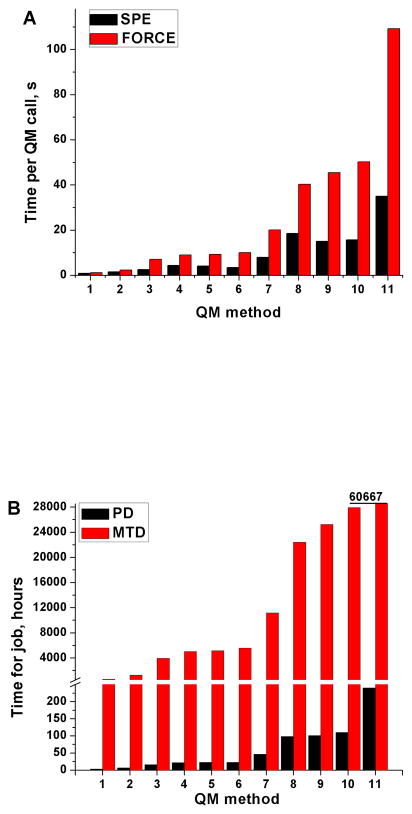
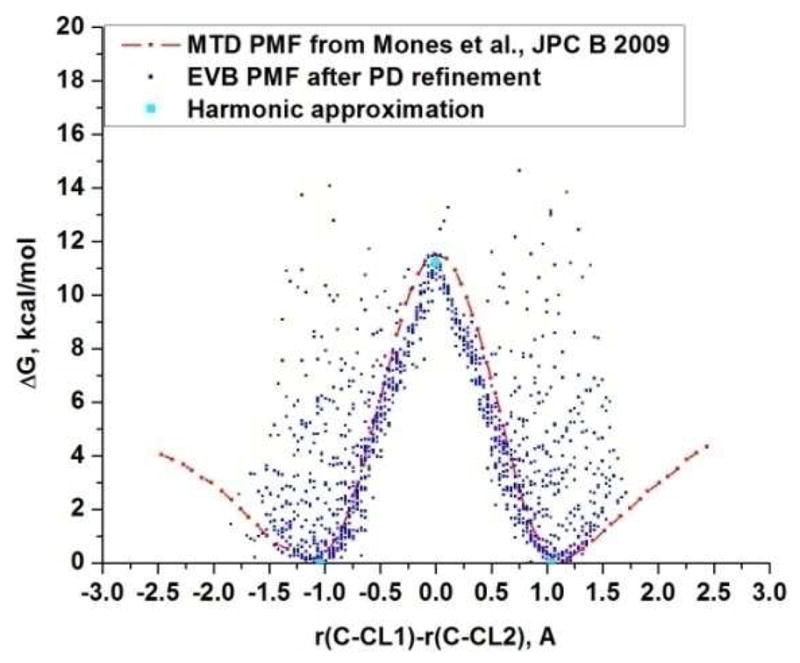
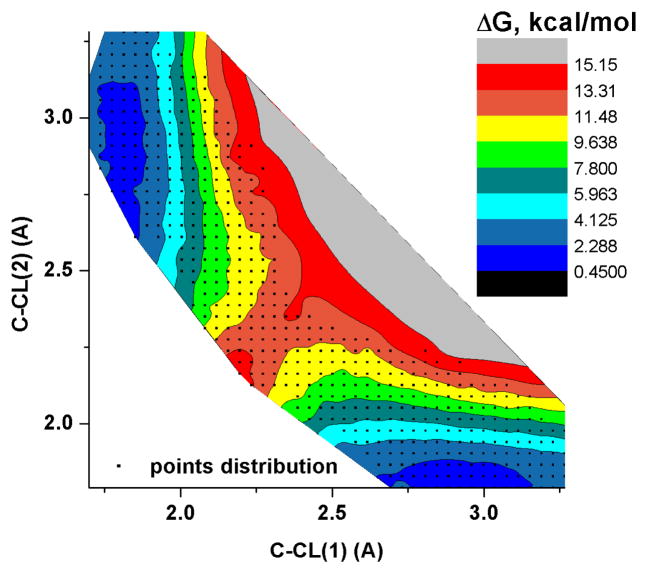
Recent years have seen tremendous effort in the development of approaches with which to obtain quantum mechanics/molecular mechanics (QM/MM) free energies for reactions in the condensed phase. Nevertheless, there remain significant challenges to address, particularly, the high computational cost involved in performing proper configurational sampling and, in particular, in obtaining ab initio QM/MM (QM(ai)/MM) free-energy surfaces. One increasingly popular approach that seems to offer an ideal way to progress in this direction is the elegant metadynamics (MTD) approach. However, in the current work, we point out the subtle efficiency problems associated with this approach and illustrate that we have at hand what is arguably a more powerful approach. More specifically, we demonstrate the effectiveness of an updated version of our original idea of using a classical reference potential for QM(ai)/MM calculations [J. Phys. Chem. 1995, 99, 17516)], which we refer to as paradynamics (PD). This approach is based on the use of an empirical valence bond (EVB) reference potential, which is already similar to the real ab initio potential. The reference potential is fitted to the ab initio potential by an iterative and, to a great degree, automated refinement procedure. The corresponding free-energy profile is then constructed using the refined EVB potential, and the linear response approximation (LRA) is used to evaluate the QM(ai)/MM activation free-energy barrier. The automated refinement of the EVB surface (and thus the reduction of the difference between the reference and ab initio potentials) is a key factor in accelerating the convergence of the LRA approach. We apply our PD approach to a test reaction, namely, the S(N)2 reaction between a chloride ion and methyl chloride, and demonstrate that, at present, this approach is far more powerful and cost-effective than the metadynamics approach (at least in its current implementation). We also discuss the general features of the PD approach in terms of its ability to explore complex systems and clarify that it is not a specialized approach limited to only accelerating QM(ai)/MM calculations with proper sampling, but rather can be used in a wide variety of applications. In fact, we point out that the use of a reference (CG) potential coupled with its PD refinement, as well as our renormalization approach, provides very general and powerful strategies that can be used very effectively to explore any property that has been studied by the MTD approach.


Figures

Figure 1
Figure 1. A conceptual comparison of meta- and paradynamics
(A) The MTD approach iteratively adds Gaussian potentials, V1’, V2’, V3’…VN’, to the real potential of the system, V0. At the final iteration, the addition of the Gaussian potential VN’ to the real potential creates a flat potential, V0+VN’, which allows for sampling of the TS region. (B) In the PD approach, the reference potential (in this case an EVB potential), V1’, is iteratively and systematically refined (V2’, V3’...VN’) to reproduce the real potential, V0. The iterative refinement of the EVB reference potential, Vn’, is aimed at reaching a situation where V0 and Vn’ almost coincide. Once this is achieved, the computationally expensive sampling on the real potential can be substituted by sampling the reference potential instead (e.g. by EVB FEP/US), plus a minor LRA correction.
Figure 2
Figure 2. The thermodynamic cycle used in calculating the QM(AI) activation free energy
The QM activation free energy (vertical dashed arrow) is calculated as the sum of the EVB barrier (vertical solid arrow) evaluated by EVBFEP/US method, and the perturbations between the QM and EVB surfaces at the RS and TS (horizontal solid arrows), which is evaluated using the LRA approach.
Figure 3
Figure 3. The SN2 reaction between chloride ion and methyl chloride
This reaction was taken as the test system in the present work. The subscripts A and B are used to distinguish between the two chlorine atoms.
Figure 4
Figure 4. Describing the EVB resonance structures
The figure illustrates the nature of the EVB bondingalong the reaction coordinate (e.g. the RS and TS), where, for each geometry, we use the two relevant diabatic states, with the indicated bonding pattern.
Figure 5
Figure 5. The initial EVB free energy surface
The figure depicts the free energy surface obtained for our SN2 reaction, prior to the refinement of any EVB parameters. The corresponding EVB parameters are given in Table S1 of the Supplementary Information.
Figure 6
Figure 6. Fluctuations of the energy gap (EQM−EEVB) for trajectories run on the initial EVB and PM3 potentials
The energy fluctuations (blue dots) were obtained during MD runs on: (A) the originalEVB potential at the RS; (B) the PM3 potential at the RS; (C) the EVB potential with constraints (see the main text) at the TS, and (D) the PM3 potential with constraints at the TS. The averages over these fluctuations (dashed orange lines) are used to obtain the LRA estimates of the free energy of transfer from the EVB to the PM3 surface (ΔΔGEVB→QM) at the RS (A, B) and TS (C, D), according to Eq. (12).
Figure 7
Figure 7. Illustrating the effect of refining the EVB parameters by the PD approach
The blue line shows the energy difference between the EVB and PM3 potentials before the parameter refinement, while the red line is the result after a series of refinement iterations done for: (A) just the structures generated at the RS, where EEVB has no contribution from H12 (EEVB (RS) = E1) and the only parameters refined are those of EVB diabatic states; and (B) both geometries lying near the RS, as well as those lying near the TS. Here the refinement is done for H12, and the Cl-C-Cl angle deformation energy parameters, while other parameters are taken from the earlier iteration round, the results of which is depicted in Fig. 7A.
Figure 8
Figure 8. The EVB free energy surface obtained with the refined parameters
This figure depicts the free energy surface obtained for our SN2 reaction, after the refinement of the EVB parameters. The refined parameters are provided in Table S2 of the Supplementary Information.
Figure 9
Figure 9. Fluctuations of the energy gap, EQM−EEVB, for trajectories run on the refined EVB and PM3 potentials
The relevant energy fluctuations (dotted lines) were obtained during MD runs on the refined EVB (red) and PM3 (blue) potentials at the RS (A) and TS (B). The average values are shown as dashed lines of the respective colors.
Figure 10
Figure 10. A comparison of the simulation times required for MTD and PD, at different levels of QM theory
(A) Time per QM call (in seconds) for different methods, for calculations of only the single point energy (SPE, black) as well as calculations that calculate both the single point energy and the energy derivatives (Force, red). The calculations of the energy and its derivatives were performed for the studied system using G03 on a single core of a Quad-Core AMD Opteron2356 CPU with 4GB available memory. (B) The estimated total number of CPU-hours required for a PD study of the test system presented in this work (black), comprising a total of 12000 QM calls, and for a corresponding MTD study of the same system (red), which would comprise 2·106 QM calls, based on Ref. . Note that the simulation time for method 11 (60667 CPU-hours) is out of scale. In both cases, the X-axis represents the relevant QM approach. The QM approaches used for the benchmark are: (1) PM3, (2) RHF/6-31G(d), (3) RMP2-FC/6-31G(d), (4) RB3LYP/6-31+G(d), (5) RmPW1PW91/6-31+G(d), (6) RMP2-FC/6-31+G(d), (7) RCISD-FC/6-31G(d), (8) RCISD-FC/6-31+G(d), (9) RMP2-FC/6-311+G(d,p), (10) RCCSD-FC/6-31G(d) and (11) RCCSD-FC/6-31+G(d).
Figure 11
Figure 11. A comparison of the free energy surfaces obtained using different approaches for the SN2 reaction studied in this work
Shown here is the free energy surface in the reaction coordinate defined by r(C−ClA)-r(C−ClB) (see Fig. 3) obtained by: EVB FEP/US after the PD refinement (blue), the MTD approach of Ref. (red) as well as the free energy values of the PM3 optimized reactant, transition and product states (cyan), obtained using the harmonic approximation.
Figure 12
Figure 12. 2-D Free Energy Surface constructed by EVB FEP/US after the PD refinement
The surface is defined in terms of the distances between the central carbon atom and the leaving and attacking nucleophiles respectively (i.e. r(C−ClA), r(C−ClB) of Fig. 3). This surface was obtained by post-processing the same job as for Figs. 8 and 11.

References

    1. Bentzien J, Muller RP, Florian J, Warshel A. J Phys Chem B. 1998;102:2293–2301.
    1. Štrajbl M, Hong G, Warshel A. J Phys Chem B. 2002;106:13333–13343.
    1. Rosta E, Klähn M, Warshel A. J Phys Chem B. 2006;110:2934–2941. - PubMed
    1. Rosta E, Haranczyk M, Chu ZT, Warshel A. J Phys Chem B. 2008;112:5680–5692. - PMC - PubMed
    1. Kamerlin SCL, Haranczyk M, Warshel A. J Phys Chem B. 2009;113:1253–1272. - PMC - PubMed

Publication types