. 2011 May 27:12:269.
doi: 10.1186/1471-2164-12-269.

The CRE1 carbon catabolite repressor of the fungus Trichoderma reesei: a master regulator of carbon assimilation

Affiliations

The CRE1 carbon catabolite repressor of the fungus Trichoderma reesei: a master regulator of carbon assimilation

Thomas Portnoy et al. BMC Genomics. .

Abstract

Background: The identification and characterization of the transcriptional regulatory networks governing the physiology and adaptation of microbial cells is a key step in understanding their behaviour. One such wide-domain regulatory circuit, essential to all cells, is carbon catabolite repression (CCR): it allows the cell to prefer some carbon sources, whose assimilation is of high nutritional value, over less profitable ones. In lower multicellular fungi, the C2H2 zinc finger CreA/CRE1 protein has been shown to act as the transcriptional repressor in this process. However, the complete list of its gene targets is not known.

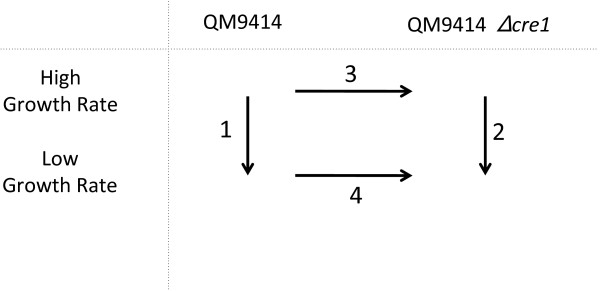
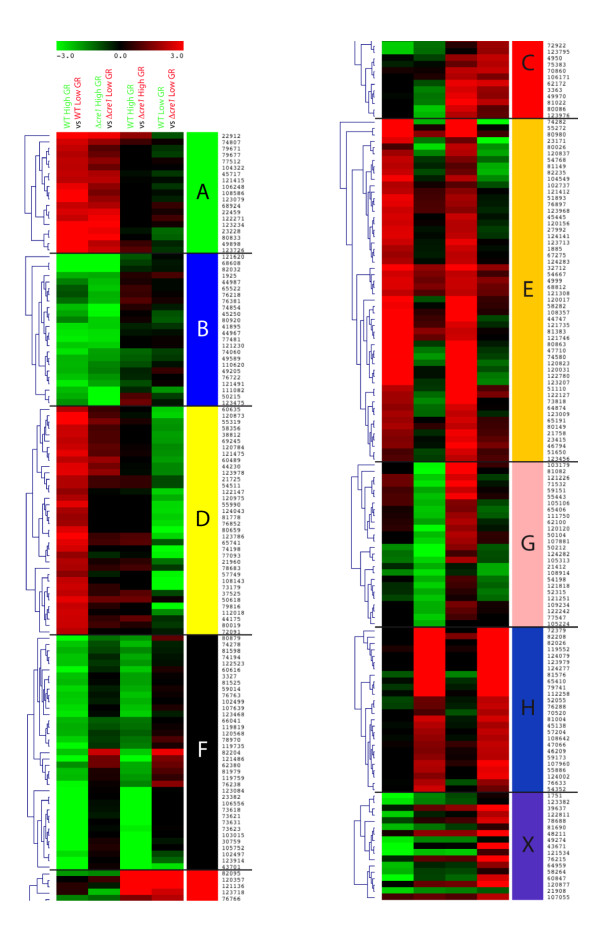
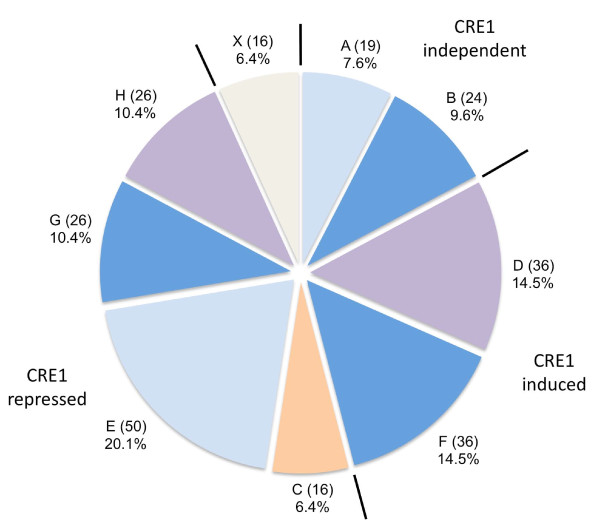
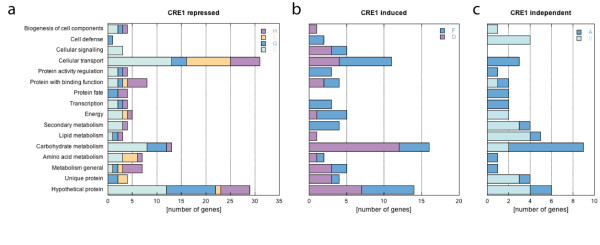
Results: Here, we deciphered the CRE1 regulatory range in the model cellulose and hemicellulose-degrading fungus Trichoderma reesei (anamorph of Hypocrea jecorina) by profiling transcription in a wild-type and a delta-cre1 mutant strain on glucose at constant growth rates known to repress and de-repress CCR-affected genes. Analysis of genome-wide microarrays reveals 2.8% of transcripts whose expression was regulated in at least one of the four experimental conditions: 47.3% of which were repressed by CRE1, whereas 29.0% were actually induced by CRE1, and 17.2% only affected by the growth rate but CRE1 independent. Among CRE1 repressed transcripts, genes encoding unknown proteins and transport proteins were overrepresented. In addition, we found CRE1-repression of nitrogenous substances uptake, components of chromatin remodeling and the transcriptional mediator complex, as well as developmental processes.

Conclusions: Our study provides the first global insight into the molecular physiological response of a multicellular fungus to carbon catabolite regulation and identifies several not yet known targets in a growth-controlled environment.


Figures

Figure 1
Figure 1
Experimental design used to study the role of CRE1 and growth rate on gene expression in T. reesei. Two strains were compared, i.e. T. reesei QM 9414 (as the reference strain) and a Δcre1 strain derived from it. In addition, two growth rates (which have previously been shown to lead to CCR repression and derepression, respectively) were compared: D = 0.07 h-1 , and D = 0.025 h-1 . Two dye switch hybridizations were performed. The position of the arrow points to the experimental condition that was used as "result" (i.e. in condition 1, the changes in expression levels at the low growth rate when compared with those at the high growth rate are given). The numbers over the arrows refer to the experiment numbers used further in text, figures and tables.
Figure 2
Figure 2
Heat map of strongly expressed genes. Heat map displaying the result from hierarchical clustering of the strongly regulated genes. The colored vertical bars give the letter identifying the respective clusters. Genes contained in the clusters are given by the ID of the encoded proteins. GR: growth rate; wt: QM 9414 wild-type strain.
Figure 3
Figure 3
Distribution of genes among expression clusters. Nine clusters, grouped according to their regulation by CRE1 (i.e. repressed, induced, or independent) were obtained from the microarray results (from A to H, and X). The color code indicates the effect of the growth rate: blue specifies clusters of genes affected only by a high growth rate (dark blue indicates upregulation, light blue downregulation). Purple specifies the genes upregulated at a low growth rate. Gene clusters whose expression is not influenced by the growth rate are given in orange. The percentages indicate the fraction of the total genes that is present in the respective cluster and the number of genes in each cluster is specified in parentheses.
Figure 4
Figure 4
Distribution of genes among the main functional categories (FunCat). The number of genes belonging to categories is presented for each cluster, with the same color code as in Figure 3. Subfigures distinguish the genes following the same classification as in the text: genes upregulated in the absence of CRE1 function (a), genes downregulated in the absence of CRE1 function (b), and genes regulated only by the growth rate but not by CRE1 (c).

References

    1. Görke B, Stülke J. Carbon catabolite repression in bacteria: many ways to make the most out of nutrients. Nat Rev Microbiol. 2008;6:613–624. doi: 10.1038/nrmicro1932. - DOI - PubMed
    1. Deutscher J. The mechanisms of carbon catabolite repression in bacteria. Curr Opin Microbiol. 2008;11:87–93. doi: 10.1016/j.mib.2008.02.007. - DOI - PubMed
    1. Gancedo JM. Carbon catabolite repression in yeast. Microbiol Mol Biol Rev. 1998;62:334–361. - PMC - PubMed
    1. Ronne H. Glucose repression in fungixs. Trends Genet. 1995;11:12–17. doi: 10.1016/S0168-9525(00)88980-5. - DOI - PubMed
    1. Westholm JO, Nordberg N, Murén E, Ameur A, Komorowski J, Ronne H. Combinatorial control of gene expression by the three yeast repressors Mig1, Mig2 and Mig3. BMC Genomics. 2008;9:601. doi: 10.1186/1471-2164-9-601. - DOI - PMC - PubMed

Publication types