. 2011 Sep;175(3):384-93.
doi: 10.1016/j.jsb.2011.05.012. Epub 2011 May 17.

Practical performance evaluation of a 10k × 10k CCD for electron cryo-microscopy

Affiliations

Practical performance evaluation of a 10k × 10k CCD for electron cryo-microscopy

Benjamin E Bammes et al. J Struct Biol. 2011 Sep.

Abstract

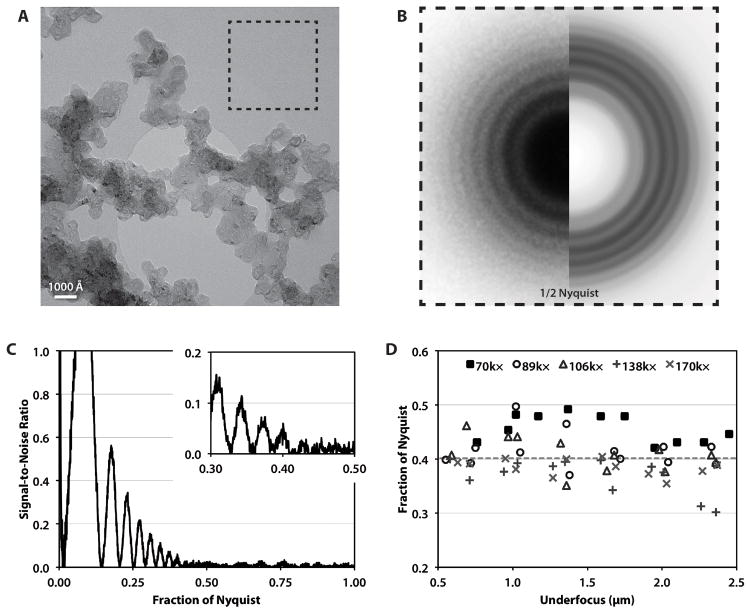
Electron cryo-microscopy (cryo-EM) images are commonly collected using either charge-coupled devices (CCD) or photographic film. Both film and the current generation of 16 megapixel (4k × 4k) CCD cameras have yielded high-resolution structures. Yet, despite the many advantages of CCD cameras, more than two times as many structures of biological macromolecules have been published in recent years using photographic film. The continued preference to film, especially for subnanometer-resolution structures, may be partially influenced by the finer sampling and larger effective specimen imaging area offered by film. Large format digital cameras may finally allow them to overtake film as the preferred detector for cryo-EM. We have evaluated a 111-megapixel (10k × 10k) CCD camera with a 9 μm pixel size. The spectral signal-to-noise ratios of low dose images of carbon film indicate that this detector is capable of providing signal up to at least 2/5 Nyquist frequency potentially retrievable for 3D reconstructions of biological specimens, resulting in more than double the effective specimen imaging area of existing 4k × 4k CCD cameras. We verified our estimates using frozen-hydrated ε15 bacteriophage as a biological test specimen with previously determined structure, yielding a ∼7 Å resolution single particle reconstruction from only 80 CCD frames. Finally, we explored the limits of current CCD technology by comparing the performance of this detector to various CCD cameras used for recording data yielding subnanometer resolution cryo-EM structures submitted to the electron microscopy data bank (http://www.emdatabank.org/).


Figures

Figure 1
Figure 1
The Electron Microscopy Data Bank (http://www.emdatabank.org) was mined to determine the usage of film and CCD detectors in biological TEM. Each EMDB entry was categorized according to the reported detection device (film or CCD) and the reported reconstruction resolution—either 1–10 nm (A) or subnanometer (B) resolution. The dashed lines (right axis) show the fraction of the EMDB entries that used a CCD detector. The results indicate that CCDs have been slowly gaining popularity for both low- and high-resolution studies, yet film has remained ~3× more popular overall.
Figure 2
Figure 2
Comparison of the US4000 and US10000XP cameras. The modulation transfer function (MTF) is shown in terms of the Nyquist frequency (A), as well as the spatial frequency (B). The curves represent averages calculated from four images of the beam-stop edges. These MTFs were subsequently used to calculate the detective quantum efficiency (DQE) in terms of the Nyquist frequency (C) and the spatial frequency (D). The dashed lines indicate the 0.07 threshold value, corresponding to ~2/3 (0.66) Nyquist and ~2/5 (0.44) Nyquist for the US4000 and the US10000XP cameras, respectively. Error bars in both the MTF and DQE plots represent the standard deviation of multiple measurements at each spatial frequency.
Figure 3
Figure 3
(A) A full CCD frame of graphitized carbon at ~70,000× detector magnification. The black box marks an example area of carbon film used to measure the decay of the signal-to-noise ratio (SNR). (B) The central part of the Fourier transform of an area of carbon film. The boundaries of the box correspond to 1/2 Nyquist. The right half has been processed to better visualize the Thon rings. (C) The spectral SNR based on the rotationally averaged Fourier transform (power spectrum) in B. (D) The spatial frequency (as a fraction of the detector Nyquist frequency) where SNR peaks were no longer distinguishable from noise. The results indicate that the CCD is capable of recording usable signal up to at least ~2/5 Nyquist (dashed line).
Figure 4
Figure 4
(A) The SNR curves of images of carbon film for a broad range of total electron exposures. 1× exposure is typical for high-resolution cryo-EM imaging, and corresponds to 20 e /Ų specimen exposure at 170,000× detector magnification. Increasing the exposure by an order of magnitude improves the resolution performance of the detector to ~3/5 Nyquist. (B) The relative change in SNR peak amplitude at varying detector exposures up to the detector saturation point (~400 e /pixel). The arrow indicates the data point corresponding to the 1× exposure curve in (A).
Figure 5
Figure 5
(A) A full CCD frame of ε15 bacteriophage at ~70,000× detector magnification at ~0.6 μm under-focus. (B) The central portion of the Fourier transform of the image in A. The boundaries of the box correspond to 1/2 Nyquist. The right half has been processed to better visualize the Thon rings. (C) The rotationally-averaged power spectrum (left axis) and spectral SNR (right axis) from the Fourier transform in B. (D) The icosahedral 3D reconstruction, with the 3-fold symmetry axis in the middle of the image shown. (E) The Fourier shell correlation (FSC) between reconstructions of two half data sets reveals the final resolution is 7.2 Å (0.35 Nyquist) by 0.5 FSC or 5.7 Å (0.45 Nyquist) by 0.143 FSC. (F) A view of the 3-fold symmetry axis from the inside of the capsid. Secondary structure is clearly distinguishable, including the long α-helix in the zoomed view.
Figure 6
Figure 6
(A) Regions of carbon film were successively imaged using unbinned and 2×-binned acquisition at 70,600× detector magnification and the same defocus. The spectral SNRs for the unbinned and 2×-binned images were indistinguishable (as shown in the example SNRs at 1.3 μm under-focus). (B) Images of frozen-hydrated ε15 bacteriophage were also collected using unbinned and 2×-binned data acquisition. Experimental B-factors (spectral signal decay) are statistically equivalent for unbinned and 2×-binned images.
Figure 7
Figure 7
Comparison of the US4000 and US10000XP CCD cameras. (A) Images of carbon film were taken with each camera at 106,000× detector magnification. Similar to Fig. 3, the spectral SNR was calculated for each image. Comparison of two carbon film images with similar defocuses shows similar SNR degradation. (B) Maximum resolution and the total imaging area for each microscope magnification for each camera. The result shows that, for any given resolution target, the US10000XP provides approximately 2.4× the total imaging area.
Figure 8
Figure 8
(A) Data points show 2/3 and 2/5 Nyquist at each detector magnification for the US4000 and US10000XP, respectively. The points for each detector lie on the same curve (green), modeled by the equation shown, representing an information limit at the detector plane of ~22.5 μm pixel size. (B) All subnanometer resolution entries in the EMDB in terms of detector type and magnification, including entries from our laboratory (yellow center). None of the CCD data (blue) reaches substantially higher resolution than our model (green curve), implying that pixel size may not be the overall limiting factor for CCD resolution. Note the reported resolution criteria vary.

References

    1. Bammes BE, Jakana J, Schmid MF, Chiu W. Radiation damage effects at four specimen temperatures from 4 to 100 K. J Struc Biol. 2010;169:331–41. - PMC - PubMed
    1. Booth CR, Jiang W, Baker ML, Zhou ZH, Ludtke SJ, et al. A 9 Å single particle reconstruction from CCD captured images on a 200 kV electron cryo-microscope. J Struct Biol. 2004;147:116–127. - PubMed
    1. Booth CR, Jakana J, Chiu W. Assessing the capabilities of a 4k×4k CCD camera for electron cryo-microscopy. J Struct Biol. 2006;156:556–63. - PubMed
    1. Brink J, Chiu W. Applications of a slow-scan CCD camera in protein electron crystallography. J Struct Biol. 1994;113:23–34. - PubMed
    1. Carragher B, Kisseberth N, Kriegman D, Milligan RA, Potter CS, et al. Leginon: an automated system for acquisition of images from vitreous ice specimens. J Struct Biol. 2000;132:33–45. - PubMed

Publication types

MeSH terms

LinkOut - more resources