. 2011 May 27;145(5):678-91.
doi: 10.1016/j.cell.2011.04.015.

DNA replication through G-quadruplex motifs is promoted by the Saccharomyces cerevisiae Pif1 DNA helicase

Affiliations

DNA replication through G-quadruplex motifs is promoted by the Saccharomyces cerevisiae Pif1 DNA helicase

Katrin Paeschke et al. Cell. .

Abstract

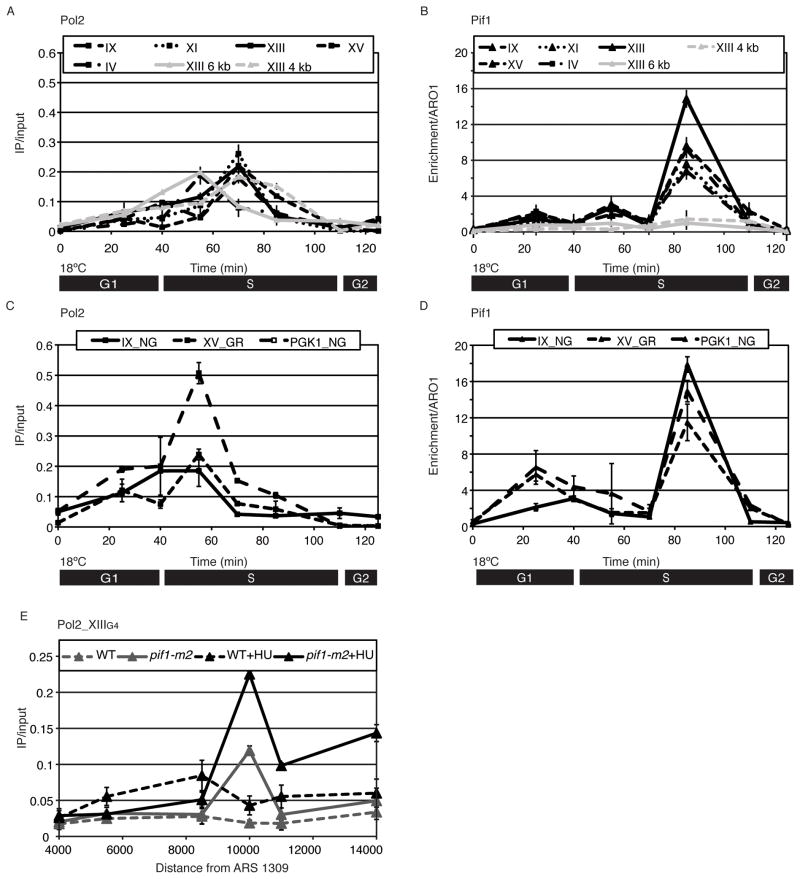
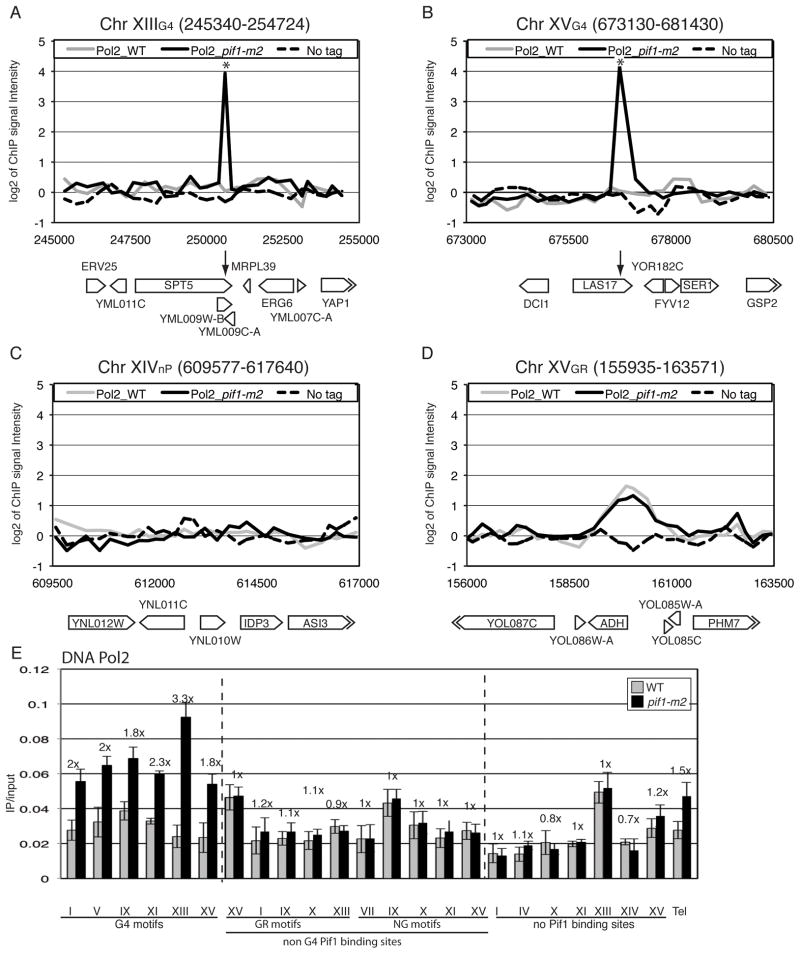
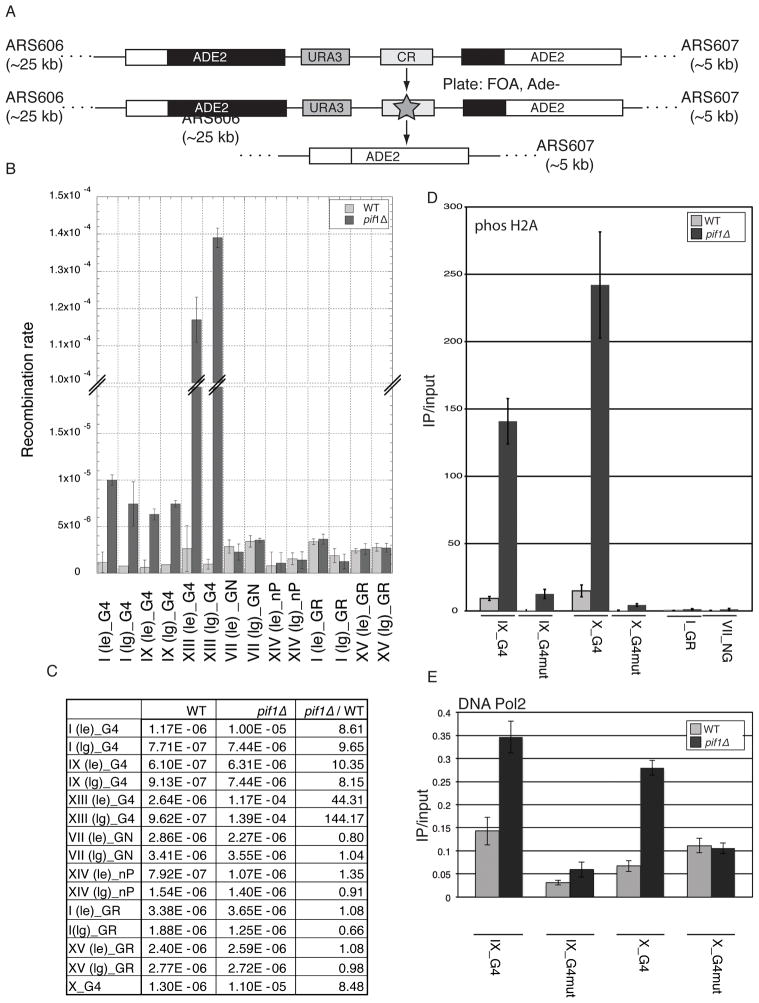
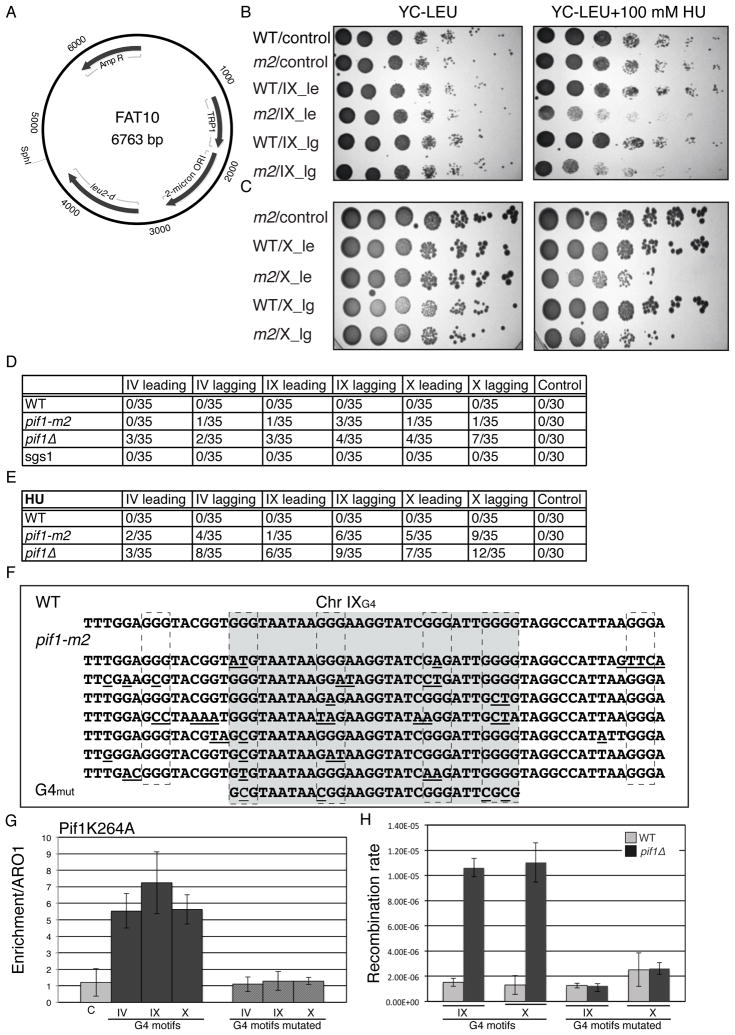
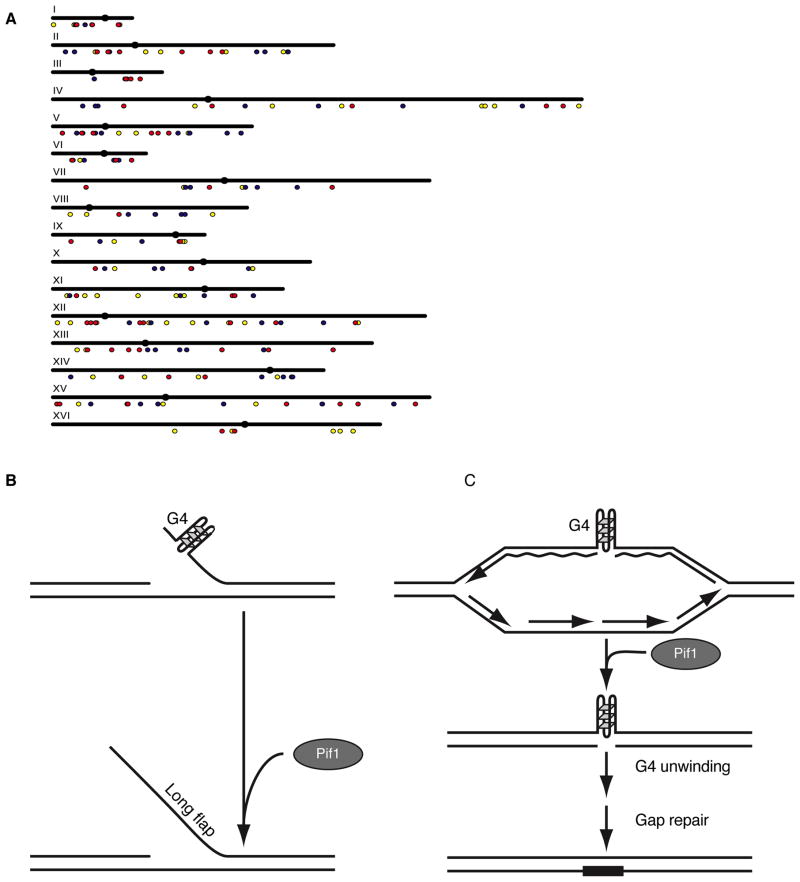
G-quadruplex (G4) DNA structures are extremely stable four-stranded secondary structures held together by noncanonical G-G base pairs. Genome-wide chromatin immunoprecipitation was used to determine the in vivo binding sites of the multifunctional Saccharomyces cerevisiae Pif1 DNA helicase, a potent unwinder of G4 structures in vitro. G4 motifs were a significant subset of the high-confidence Pif1-binding sites. Replication slowed in the vicinity of these motifs, and they were prone to breakage in Pif1-deficient cells, whereas non-G4 Pif1-binding sites did not show this behavior. Introducing many copies of G4 motifs caused slow growth in replication-stressed Pif1-deficient cells, which was relieved by spontaneous mutations that eliminated their ability to form G4 structures, bind Pif1, slow DNA replication, and stimulate DNA breakage. These data suggest that G4 structures form in vivo and that they are resolved by Pif1 to prevent replication fork stalling and DNA breakage.


Figures

Figure 1
Figure 1. Pif1 binds G4 motifs in vivo
(A–D) Here and in subsequent figures, roman numerals indicate the chromosome on which the region is located. Log2 values of Pif1-K264A (solid dark lines) and WT Pif1 (grey lines) binding compared to the no tag control (dotted line) within four 10 kb regions, two containing a Pif1 binding G4 motif (XIIIG4, A; XVG4, B) and two G-rich but non G4 regions, one with no significant Pif1 binding (XIVnP, C) and one with strong Pif1 binding (XVGR, D). Here and in subsequent figures, asterisks mark locations of G4 motifs; arrows indicate protein binding sites; annotations corresponding to the coordinates are shown below the plot (related to Table S1). E) qPCR analysis of Pif1-K264A association at G4 motifs (black), non G4 Pif1-K264A binding sites (both NG, not G-rich and GR, non G4 G-rich) (white), non Pif1 binding regions (nP, grey) and controls (VI-R telomere, Tel and rDNA, rD; striped). Here and in all subsequent Pif1 ChIP analysis, values were normalized to both input and the amount of ARO1 DNA in the immuno-precipitate. Here and elsewhere error bars are +/− SD.
Figure 2
Figure 2. Pif1 binds G4 motifs after semi-conservative replication of the motif
(A–D) Cells expressing HA tagged DNA Pol2 (Pol2) and MYC tagged Pif1 (Pif1) were synchronized, and samples taken for ChIP at the indicated times. DNA in the immuno-precipitate (IP) was quantitated by qPCR. Here and in all subsequent DNA Pol2 ChIPs, the amount of DNA in the IP was normalized to input DNA (IP/input). Log2 values for DNA Pol2 (A,C) or Pif1 enrichment (B,D) at various Pif1 binding sites. Loci examined were G4 motifs (A, B, black), non G4 regions with no Pif1 binding (6 kb to the left and 4 kb to the right of Chr XIIIG4; A, B, grey) and non G4 regions with strong Pif1 binding (IXNG, non G-rich, XVGR G-rich), and a highly transcribed gene (PGK1NG) (C, D) (related to Figure S1) (E) DNA Pol2 binding to the Chr XIIIG4 motif and its flanking regions was determined in asynchronous cells growing with or without HU in pif1-m2 and WT cells. The G4 motifs is 10 kb from ARS1309.
Figure 3
Figure 3. G4 motifs have increased DNA Pol2 occupancy in pif1-m2 versus WT cells
Asynchronous WT and pif1-m2 cells expressing DNA Pol2-MYC were analyzed by ChIP-microarray experiments (Fig. 1A–D). Log2 values of DNA Pol2 binding in pif1-m2 (solid dark lines) and WT cells (grey lines) compared to the no tag control (dotted line) within four 10 kb regions. (A,B) Two regions have G4 motifs (XIIIG4, A; XVG4, B) and two are G-rich regions, one that did not (XIVnP, C) and one that did bind Pif1 (XVGR, D) (related to Table S3) (E) qPCR analysis of DNA Pol2-MYC association in WT (grey) and pif1-m2 (black) cells at G4 motifs, non G4 Pif1-K264A binding sites (NG, not G-rich; GR, G-rich non G4), non Pif1 binding regions and the VI-R telomere (Tel). The numbers above the column indicate the fold DNA Pol2 enrichment in pif1-m2 over WT cells at each locus.
Figure 4
Figure 4. Two-dimensional (2D) gel analysis detects replication fork slowing in the vicinity of G4 motifs in HU grown pif1-m2 cells
DNA was prepared from asynchronous WT or pif1-m2 cells grown with or without 30 mM HU for 3 h, digested with restriction enzymes, and analyzed by 2D gels. Restriction enzymes were chosen so that the G4 motif is positioned ~75% of the way through the arc of forked replication intermediates. (A–C) Replication through three G4 motifs. (D, E) Replication through five non G4 loci. (Only DNA from HU grown cells are shown for samples in D and E.) Cartoon at the bottom of each panel indicates genomic location, distance to the nearest ARS, digestion site, and position of G4 motif. Media and strain conditions are indicated at top of figure. Arrows point to converging forks. The fraction of DNA in forked intermediates (FI) and in the 1N spot was determined using ImageQuant. The average ratio of three independent experiments ± SD of FI/1N pif1-m2 divided by FI/1NWT (no HU) was 1.0 ± 0.4 (Chr IXG4), 1.3 ± 0.4 (Chr XIIIG4) and 1.1 ± 0.5 (Chr XVG4); in HU grown cells, values were 3.1 ± 0.4 (IXG4), 4.2 ± 0.7 (XIIIG4) and 3.2 ± 0.7 (XVG4). D/E) 2D gel analysis of five control regions from genomic DNA from WT (E) and pif1-m2 (D) cells in 30 mM HU: Chr IGR (strong Pif1 binding region), Chr XIVnP (G-rich region, no Pif1 binding), Chr IXNG (non G rich Pif1 binding site), Chr XIIING (~ 10 kb upstream of Chr XIIIG4; up Chr XIIIG4, no Pif1 binding), and the highly transcribed TEF1 gene (no Pif1 binding).
Figure 5
Figure 5. G4 motifs enhance direct repeat recombination and are fragile sites in Pif1 deficient cells
G4 and non G4 Pif1 binding sites were integrated into a recombination cassette on Chromosome VI. (A) Schematic diagram of recombination assay. Star indicates cloning region. (B) Recombination rates for WT (grey) and pif1Δ (dark) cells. pif1-m2 cells were not used because for unknown reasons, the direct repeat recombination substrate could not be recovered in this background. The inserts were 90 to 150 bps. All inserts were tested in both leading (le) and lagging (lg) strand orientation relative to the nearest ARS. (C) Average recombination rates from four independent experiments. Enrichment values are pif1Δ/WT for a given insert and orientation. (D) Binding of phosphorylated H2A was measured by ChIP/qPCR at different recombination substrates in WT (grey) and pif1Δ (dark) cells. Phosphorylated H2A levels were determined at two G4 motifs IXG4, XG4, two mutated G4 motifs IXG4mut and XG4mut as well as two non G4 Pif1 binding sites (IGR, VIING). Levels of phosphorylated H2A at IGR and VIING in WT and pif1Δ ranged between 0.4–1.3. All phosphorylated H2A values were normalized to input (IP/input). (E) DNA Pol2 was tagged in recombination substrates and analyzed by ChIP/qPCR in WT (grey) and pif1Δ (dark) cells. DNA Pol2 occupancy was analyzed at two different G4 motifs (IXG4 and XG4) and two mutated G4 motifs IXG4mut and XG4mut.
Figure 6
Figure 6. G4 motifs are mutated in the absence of Pif1
(A) Map of FAT10 plasmid used to introduce extra copies of G4 motifs. (B, C) 1:10 dilutions of WT and pif1-m2 (m2) cells carrying control plasmid (control) or plasmid with: Chr IXG4 (B) or Chr XG4 (C) on the leading (le) or lagging (lg) strand. Cells were plated on YC-LEU (left) and YC-LEU+100 mM HU (right). (D) Fraction of mutated inserts in various strains after plating on YC-LEU (D) or YC-LEU+HU (E). (F) Examples of mutations recovered from Chr IXG4; mutated bases are underlined. Gray shaded area indicates G4 motif. Alternative G4 islands are indicated by a dashed box. (G) ChIP/qPCR analysis of Pif1-K264A to indicated inserts in FAT10. Association was examined at the control insert (light grey) IVG4, IXG4, XG4 (dark bar) as well as at IVG4mut, IXG4mut, XG4mut (grey bar). (H) Recombination rates for WT (grey) and pif1Δ (dark) cells at two G4 motifs (IXG4, XG4) and the same motifs mutated (IXG4mut, XG4mut).
Figure 7
Figure 7. Model of Pif1 function at G4 structures
(A) Distribution of G4 motifs that bound Pif1-K264A (yellow), had high DNA Pol2 binding in pif1-m2 cells (blue), or both (red) among the 16 yeast chromosomes (related to Table S2). Filled circles mark centromeres (B, C) Working model for Pif1 action at G4 structures on Okazaki fragments (B) and after replication of a region with a G4 structure (C). The figure shows structure formation on the leading strand template, but our data suggest that G4 structures form on both leading and lagging strand templates. Repair synthesis is denoted by thick line. See discussion for details.

Comment in

References

    1. Azvolinsky A, Dunaway S, Torres J, Bessler J, Zakian VA. The S. cerevisiae Rrm3p DNA helicase moves with the replication fork and affects replication of all yeast chromosomes. Genes Dev. 2006;20:3104–3116. - PMC - PubMed
    1. Azvolinsky A, Giresi P, Lieb J, Zakian V. Highly transcribed RNA polymerase II genes are impediments to replication fork progression in Saccharomyces cerevisiae. Mol Cell. 2009;34:722–734. - PMC - PubMed
    1. Benjamini Y, Hochberg Y. Controlling the false discovery rate: a practical and powerful approach to multiple testing. JRoy Statist Soc Ser B. 1995;57:289–300.
    1. Bochman ML, Sabouri N, Zakian VA. Unwinding the functions of the Pif1 family helicases. DNA Repair (Amst) 2010;9:237–249. - PMC - PubMed
    1. Boule J, Vega L, Zakian V. The Yeast Pif1p helicase removes telomerase from DNA. Nature. 2005;438:57–61. - PubMed

Publication types

MeSH terms