. 2011 Aug 15;17(16):5299-310.
doi: 10.1158/1078-0432.CCR-10-2847. Epub 2011 May 27.

Brivanib, a dual FGF/VEGF inhibitor, is active both first and second line against mouse pancreatic neuroendocrine tumors developing adaptive/evasive resistance to VEGF inhibition

Affiliations

Brivanib, a dual FGF/VEGF inhibitor, is active both first and second line against mouse pancreatic neuroendocrine tumors developing adaptive/evasive resistance to VEGF inhibition

Elizabeth Allen et al. Clin Cancer Res. .

Abstract

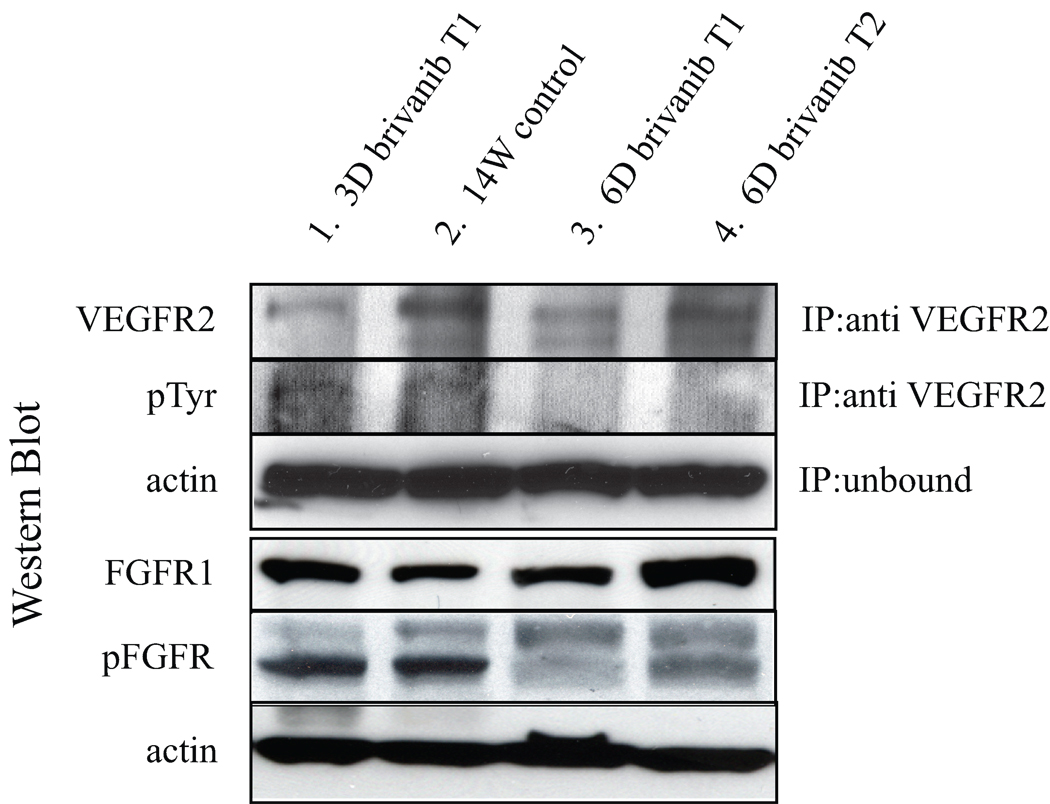
Purpose: Preclinical trials of a mouse model of pancreatic neuroendocrine tumors (PNET) were conducted to determine whether dual FGF/VEGF pathway inhibition with brivanib can improve first-line efficacy in comparison with VEGF inhibitors lacking fibroblast growth factor (FGF)-inhibitory activity and to characterize second-line brivanib activity before and after the onset of evasive resistance to VEGF-selective therapy.

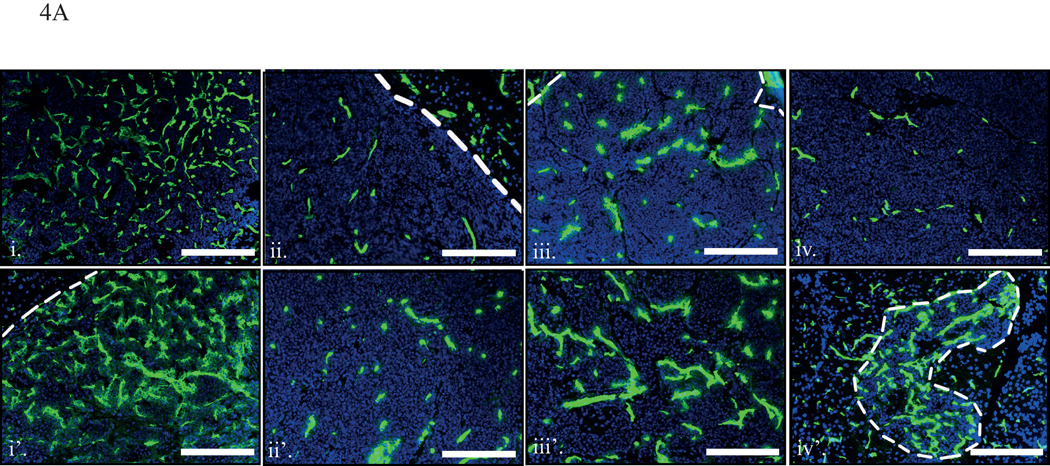
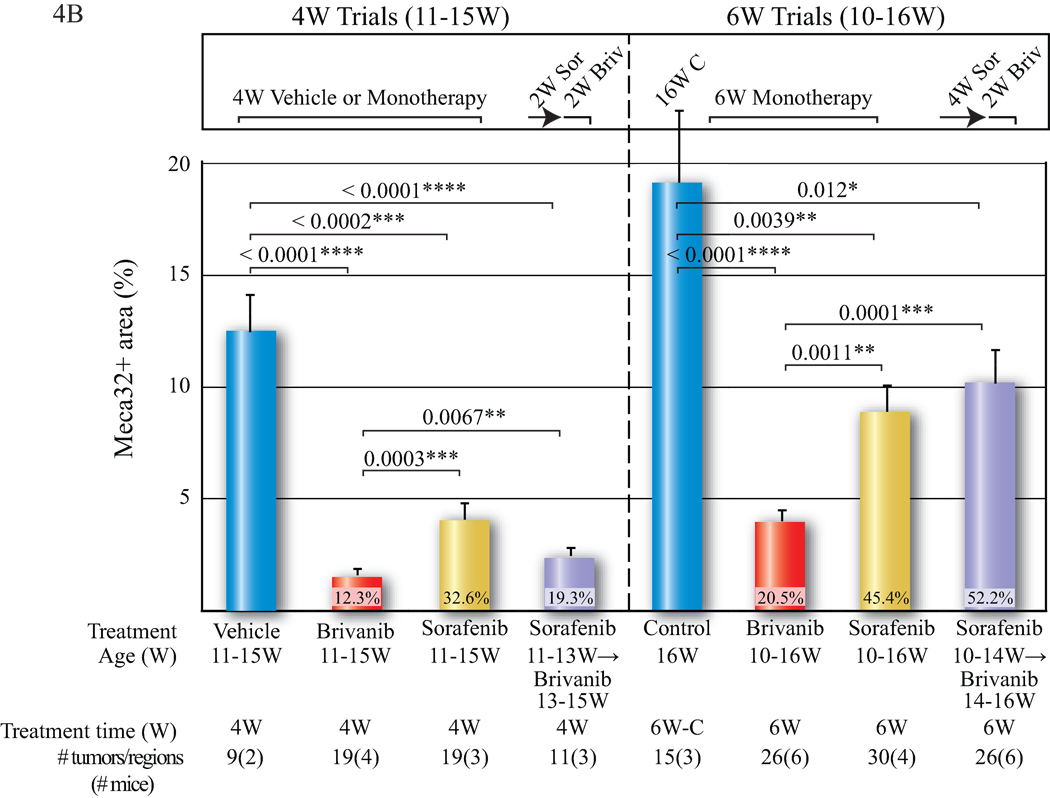
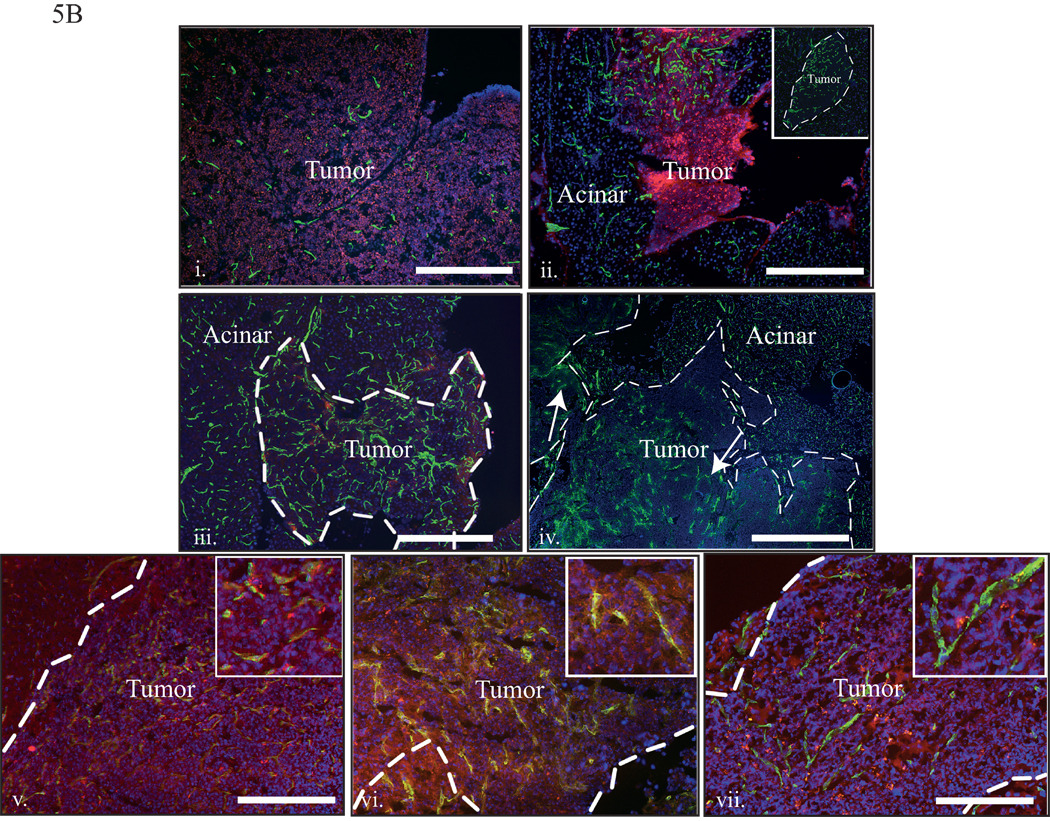
Experimental design: An anti-VEGFR2 monoclonal antibody (DC101), an inhibitor of FGF signaling (FGF ligand trap), sorafenib, and brivanib were comparatively evaluated in first-line monotherapy in short and longer term fixed endpoint intervention trials in the RIP-Tag2 mouse model of PNET. Brivanib was also tested second line aiming to block adaptive resistance to selective VEGF therapies, assessing tumor growth, vascularity, hypoxia, invasion, and metastasis. The effects of initiating second-line brivanib therapy prior to or following overt relapse on sorafenib therapy were compared in overall survival trials to first-line therapies.

Results: Brivanib produced enduring tumor stasis and angiogenic blockade, both first and second line following the failure of DC101 or sorafenib. Overall survival was significantly extended by brivanib versus sorafenib, both first-line and when second-line therapy was initiated prior to sorafenib failure; second-line brivanib was less beneficial when initiated later, after the initiation of revascularization and incipient tumor progression.

Conclusions: Brivanib holds promise and deserves consideration for clinical evaluation as an antiangiogenic therapy, both in the context of impending failures of VEGF-selective therapy and in a first-line setting aiming to limit the adaptive response to VEGF inhibitors that results in evasive resistance.


Conflict of interest statement

Disclosure of Potential Conflicts of Interest

Ian Walters is an employee of Bristol-Myers Squibb. Douglas Hanahan is a consultant to Onyx Pharmaceutics, which co-markets sorafenib. Elizabeth Allen has no potential conflict of interest.

Figures

Fig. 1
Fig. 1. Target inhibition of VEGFR2 and FGFR in brivanib-treated tumors
Protein lysates were prepared from short-term brivanib treated total tumors after 3 days (3D) or six days (6D) (starting at 14 weeks of age), and equal levels of each are shown in lanes 1, 3, and 4, along with control lysates from 14 week (14W) untreated tumors in lane 2. Lysates were immunoprecipitated (IP) with anti-VEGFR2, and analyzed by western blotting with anti-VEGFR2 or pTyr; equal fractions of each lysate were blotted with β-actin (upper actin panel) as a measure of relative levels of total protein used for IP. The lower three panels depict western blot analysis of equal levels of lysate probed with pFGFR antibody (middle), and sequentially stripped and reprobed with anti-FGFR1 (top), followed by anti-β-actin (bottom actin panel).
Fig. 2
Fig. 2. Comparative efficacy of brivanib versus pure VEGFR2 and FGFR inhibitors
A. First line brivanib versus DC101 and FGF-trap. To assess brivanib’s efficacy, intervention trials were performed in compound RIP1-Tag2 (RT2), Rag1-null mice for 2 weeks (left panel) or 4 weeks (right panel). There was no significant difference in tumor burden at 2 weeks between any of the treatments (brivanib, DC101, and FGFtrap). After 4 weeks, the DC101 arm had significantly larger tumors than at 2 weeks, and compared to 2 weeks and 4 weeks of brivanib treatment. FGF-trap had equivocal efficacy, since mice did not survive longer than the first 2 weeks of monotherapy. Mean values +/− SEM are indicated. 2-tail Mann-Whitney test for statistical significance; *p = 0.05-0.01, **p = 0.009-0.001, ***p< 0.001. W = week. B. Second line brivanib versus combined DC101 and FGF-trap. To assess brivanib’s efficacy as a 2nd line therapeutic, an additional intervention trial was performed in RT2;Rag1-null mice. Following 2 weeks of DC101 monotherapy, at which point FGF-dependent revascularization is being induced, either FGF-Trap was layered on top of DC101 for two weeks of combined therapy, or brivanib was substituted for DC101 as a sole 2nd line therapeutic. An additional arm combined DC101 and brivanib throughout the 4 week long trial, which produced a slightly better but statistically insignificant effect on tumor burden. To facilitate comparison, the monotherapy trial arms from Fig. 2A re-depicted here are shown in bold italics and green font. Mean values +/− SEM are indicated. 2-tail Mann-Whitney test; *p = 0.01-0.05, **p < 0.009.
Fig. 3
Fig. 3. Comparative efficacy of brivanib versus sorafenib, a clinically approved VEGFR/PDGFR inhibitor, in intervention trials in RT2 mice
A. Intervention trials - brivanib versus sorfafenib. 4 week intervention trials performed in RT2 mice demonstrated similar efficacy for brivanib and sorafenib, and a sequential 2 week regimen of sorafenib followed by brivanib (left panel). Because a subset of sorafenib treated tumors evidenced signs of therapeutic failure at 4 week (exemplified in Fig. 3B, panel ii), we assessed brivanib 2nd line following the impending failure after 4 weeks of sorafenib (right panel). Six weeks of sorafenib resulted in a modest but statistically insignificant increase in tumor burden versus the 1st and 2nd line brivanib arms, which produced stable disease over this same time course. Mean values +/− SEM are indicated. 2-tail Mann-Whitney test; *p = 0.05-0.01, **p = 0.009-0.001, ***p<0.0009. B. Adaptation in DC101 and sorafenib treated tumors. Panel i depicts a tumor treated for 2 weeks with DC101 that shows distinct regions of hypoxia and revascularization, visualized by immunofluorescence for pimozidomle (hypoxia; green) and anti-Meca32 (blood vessels; red). The result is representative of several similar tumors in the animal, although those in another DC101 treated member of the cohort showed no signs of revascularization, indicative of a heterogeneity in the adaptive response. Panel ii depicts a tumor after 4 weeks of sorafenib treatment that has begun to undergo evasion from antiangiogenic therapy as evidenced by revascularization and invasive margins. The blood vessels were visualized by staining with anti-Meca32 and visualized with horseradish peroxidase. Such marked revascularization was infrequent after 4 weeks of sorafenib monotherapy (and was not observed after 4 weeks of brivanib treatment), but was widespread in 2 surviving animals after 7.1–7.6 of sorafenib treatment (see Fig. 5B, panel iv). The white dashed line delineates the neoplastic lesion in both panels. Scale bar represents 400 µM (i), and 100 µM (ii).
Figure 4
Figure 4. Vascularity of brivanib/sorafenib treated tumors in fixed endpoint trials
A. Immunostaining analysis of vascularity in 4 and 6 week fixed endpoint brivanib/sorafenib trials. Mice were treated for four weeks (W) (from 11–15 weeks of age) (top panels, i–iv) or for six weeks (from 10–16 weeks) (bottom panels, i’–iv’) and analyzed for tumor vascularity with Meca32 (green). Control untreated tumors showed characteristically high vascularity (panels i, and i’). Brivanib monotherapy (panels ii and ii’), sorafenib monotherapy (panels iii and iii’), or 2W of sorafenib followed by 2W of brivanib (panel iv) or 4W of sorafenib followed by 2W of brivanib (panel iv’) are shown. All 4W treatments produced markedly less-vascularized tumors than controls. After 6W of treatment, the majority of brivanib treated tumors (panel ii’) showed no sign of revascularization, in contrast to 6W sorafenib treated tumors (panel iii’); surprisingly, although the 4W sorafenib->2W brivanib arm shows no increase in tumor size (Fig. 3A), some tumors are extensively revascularized, (panel iv’), suggestive of impending relapse to progressive growth. Scale bars represent 100 µM. B. Quantification of vascularity. Multiple tumors and regions within each tumor (see Supplementary Materials and Methods) were immunostained with Meca32, and Metamorph analysis was used to quantitatively assess total tumor vascularity. Results from each treatment group were combined. Both four and six week brivanib monotherapy produced significantly lower levels of vascularity than other treatment groups. Tumor vascularity was markedly higher following 6 weeks of sorafenib monotherapy, as well as from 2nd line brivanib following sorafenib (4 weeks of sorafenib followed by 2 weeks of brivanib), as compared to 1st line brivanib. All treatment regimens produced significantly lower vascularity than untreated tumors. Mean values +/− SEM are indicated. 2-tail Mann-Whitney test; *p = 0.010–0.050, **p = 0.001–0.009, ***p = 0.0001–0.0009, ****p < 0.0001.
Figure 5
Figure 5. Survival trials - first and second line brivanib vs. sorafenib
A. Survival Trials/Meier-Kaplan analysis. Survival trials were performed from week 10 until endpoint in RT2 mice. Because the 4W 1st line sorafenib followed by 2nd line brivanib until endpoint begins at week 14 (prior to that the mice are in the sorafenib monotherapy arm), all arms are assessed here starting at 14 weeks. All data starting from 10 weeks onward are shown in Supplementary Fig. 5 and Supplementary Table 2, and are not substantially different from results depicted here. Cohorts were composed of 12–16 mice/arm, and p-values were derived using the log rank test (LR). Survival was assessed between control vehicle treated mice (n=14; 6.4 +/− 1.4 weeks of survival); brivanib monotherapy (n=12; 10.1 +/− 2.5 weeks); sorafenib monotherapy (n=16; 7.6 +/− 1.4 weeks); 2 week 1st line sorafenib followed by 2nd line brivanib until endpoint (n=12; 9.7 +/− 2.6 weeks), and 4W 1st line sorafenib followed by 2nd line brivanib until endpoint (n=12; 9.2 +/− 2.6 weeks). All treated arms show significantly higher survival than untreated mice (see Supplementary Table 2). When compared to sorafenib monotherapy, the arms involving either brivanib monotherapy (p=0.001) and 2 weeks (p=0.002) or 4 weeks (p=0.028) of 1st line sorafenib followed by 2nd line brivanib until endpoint showed significantly higher survival. Interestingly, the cohort in which initiation of brivanib was delayed (4 week 1st line sorafenib followed 2nd line brivanib until endpoint) produced a pronounced shoulder in the survival curve, indicative of the survival benefit resulting from second line brivanib therapy, even when initiated “late”. Mean values +/− SD are indicated, log rank test (LR) for statistical significance; *p = 0.05-0.01, **p < 0.01. B. Survival trials – IF analysis of end-stage treated tumors. Histological analysis by fluorescent imunostaining (IF) was performed on tumors from mice in the survival trial that were found at end stage to be amenable for excising tumors. All tumors with good morphology from 2 mice/treatment arm were analyzed, with representative images depicted. Panel i shows a large, non-invasive tumor from a mouse treated with brivanib monotherapy for 10.6 weeks (until 20.6 weeks of age; anti-Meca32, green; T-antigen, red), which evidenced continued angiogenic blockade by its low vascularity. Panel ii depicts a tumor from a second end stage brivanib monotherapy mouse (8.6 week treatment, at 18.6 weeks of age; anti-Meca32, green; T-antigen, red, and inset) that evidenced signs of therapeutic evasion, including tumor revascularization (Meca32, green) and invasion (T-antigen, red). Panel iii depicts a revascularized, and invasive tumor that resulted from 4 weeks of sorafenib followed by 4.4 weeks of 2nd line brivanib (panel iii, 8.4 week treatment total, 18.4 weeks of age; anti-Meca32, green). Panel iv depicts a revascularized and invasive tumor from an end-stage mouse treated with sorafenib monotherapy (7.6 week sorafenib, 17.6 weeks of age; anti-Meca32, green). Note the diffuse vasculature, invasive border, and irregular revascularization. To assess maintenance of the VEGFR signaling blockade, tumors from a 7.6 week vehicle-treated tumor (panel v), a 7.6 week sorafenib-treated tumor (panel vi) and an 11 week brivanib-treated tumor (panel vii) (both monotherapy) were stained with Meca32 (green) and pVEGFR (red) antibodies; the merged (yellow) images are indicative of VEGR signaling (yellow) for sorafenib monotherapy (panel vi, and inset) and control vehicle (panel v, and inset) treated tumors, in contrast to predominantly p-VEGFR2-negavive staining of endothelium in brivanib treated tumors (panel vii, green). Scale bar represents 400 µM (i, ii, iv), 200 µM (iii), and 100 µM (v–vii). Panels iv is false colored to maintain consistency between panels.

Comment in

  • Overcoming antiangiogenic resistance.
    Yao JC, Phan A. Yao JC, et al. Clin Cancer Res. 2011 Aug 15;17(16):5217-9. doi: 10.1158/1078-0432.CCR-11-1219. Epub 2011 Aug 9. Clin Cancer Res. 2011. PMID: 21828238

References

    1. Eriksson B. New drugs in neuroendocrine tumors: rising of new therapeutic philosophies? Curr Opin Oncol. 2010 Jul;22(4):381–386. - PubMed
    1. Scagliotti G, Govindan R. Targeting angiogenesis with multitargeted tyrosine kinase inhibitors in the treatment of non-small cell lung cancer. Oncologist. 2010;15(5):436–446. - PMC - PubMed
    1. Keating GM, Santoro A. Sorafenib: a review of its use in advanced hepatocellular carcinoma. Drugs. 2009;69(2):223–240. - PubMed
    1. Tomillero A, Moral MA. Gateways to clinical trials. Methods Find Exp Clin Pharmacol. 2009 Jul–Aug;31(6):397–417. - PubMed
    1. Huynh H. Tyrosine kinase inhibitors to treat liver cancer. Expert Opin Emerg Drugs. 2010 Feb 3; - PubMed

Publication types

MeSH terms