Review
. 2011 May 27;11(5):5.
doi: 10.1167/11.5.5.

Eye guidance in natural vision: reinterpreting salience

Affiliations
Review

Eye guidance in natural vision: reinterpreting salience

Benjamin W Tatler et al. J Vis. .

Abstract

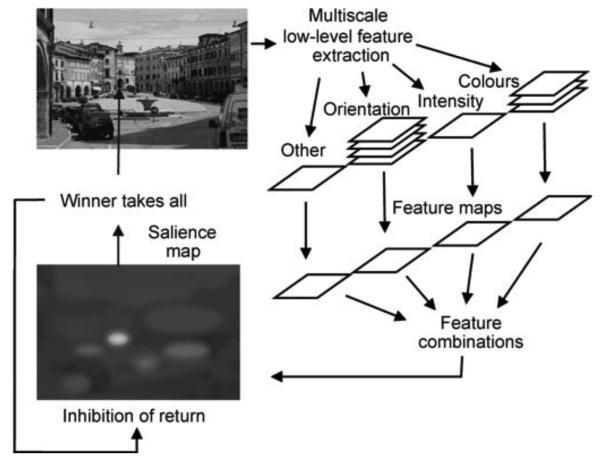
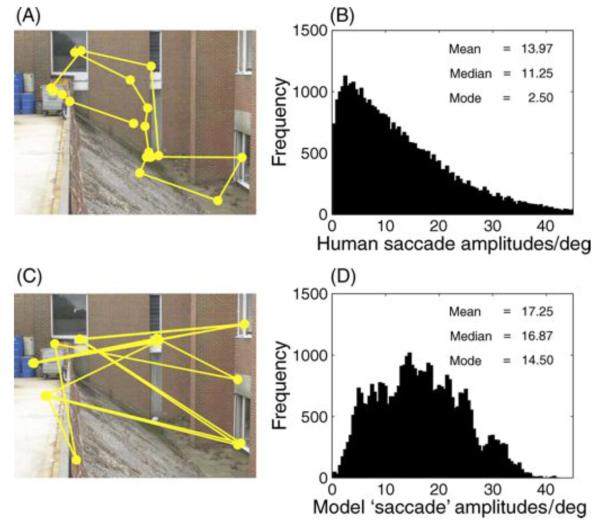
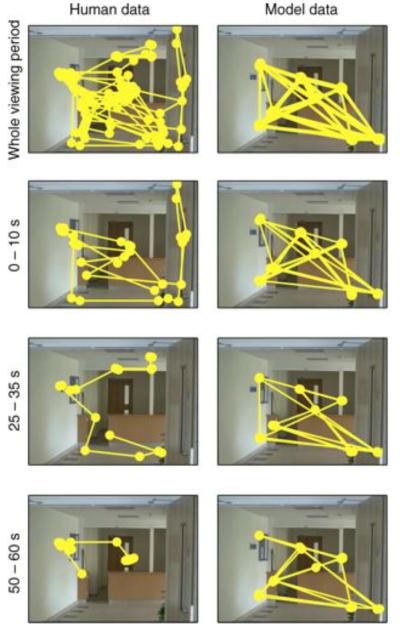
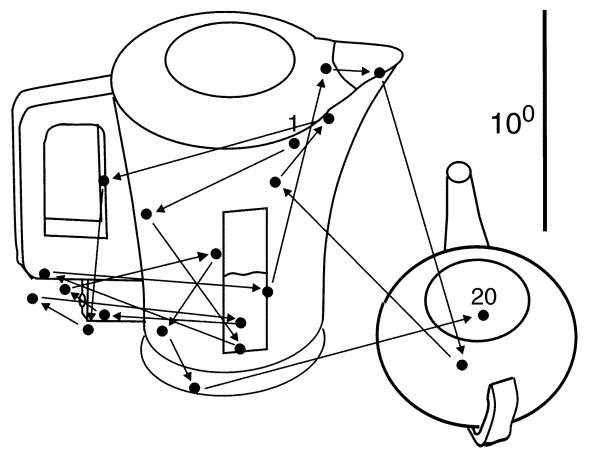
Models of gaze allocation in complex scenes are derived mainly from studies of static picture viewing. The dominant framework to emerge has been image salience, where properties of the stimulus play a crucial role in guiding the eyes. However, salience-based schemes are poor at accounting for many aspects of picture viewing and can fail dramatically in the context of natural task performance. These failures have led to the development of new models of gaze allocation in scene viewing that address a number of these issues. However, models based on the picture-viewing paradigm are unlikely to generalize to a broader range of experimental contexts, because the stimulus context is limited, and the dynamic, task-driven nature of vision is not represented. We argue that there is a need to move away from this class of model and find the principles that govern gaze allocation in a broader range of settings. We outline the major limitations of salience-based selection schemes and highlight what we have learned from studies of gaze allocation in natural vision. Clear principles of selection are found across many instances of natural vision and these are not the principles that might be expected from picture-viewing studies. We discuss the emerging theoretical framework for gaze allocation on the basis of reward maximization and uncertainty reduction.


Figures

Figure 1
Figure 1
Schematic of Itti's salience model. Figure from Land and Tatler (2009); redrawn from Itti and Koch (2000).
Figure 2
Figure 2
Saccade amplitudes from humans and the salience model. (A) Sample scan path from one participant looking at a photographic scene for 5 s. (B) Overall distribution of saccade amplitudes from humans looking at photographic scenes (N = 39,638 saccades). Data are taken from 22 participants, viewing 120 images for 5 s each. These data are drawn from the participants in Tatler and Vincent (2009) and full participant information can be found in this published paper. (C) Sample scan path from Itti's salience model. Simulation data are generated using the latest version of the saliency tool box downloaded from http://www.saliencytoolbox.net using the default parameters. Full details of the model can be found in Walther and Koch (2006). The simulation shown here was for the same number of “saccades” as recorded for the human data shown in (A). (D) Overall distribution of simulated saccade amplitudes from the salience model (N = 39,638 simulated saccades). Separate simulations were run for 22 virtual observers “viewing” the same 120 images as the human observers used in (B). For each image, the virtual observer made the same number of simulated saccades as the human observer had on that scene. The salience model produces larger amplitude saccades than human observers and does not show the characteristic positively skewed distribution of amplitudes.
Figure 3
Figure 3
Behaviour during extended viewing for (left) a human observer and (right) the salience model. The human observer viewed the scene for 60 s with no instructions. The model simulated the same number of fixations as made by the observer during viewing (N = 129 fixations). Data are shown for the entire viewing period (top row). Note that the salience model simply cycles around a small number of locations, whereas the observer does not. The lower three rows show data divided into the first 10 s, the middle 10 s, and the !nal 10 s of viewing, with matched portions from the simulated sequence of fixations generated by the salience model. Simulation data were generated using the latest version of the saliency tool box downloaded from http://www.saliencytoolbox.net using the default parameters. Full details of the model can be found in Walther and Koch (2006).
Figure 4
Figure 4
Profligacy in eye movement behavior. From Land and Tatler (2009).
Figure 5
Figure 5
When subjects navigating a virtual environment are told to approach and pick up an object, their !xations tend to be centered on the object, but when the subjects are told to avoid the object, their fixations hug the edge of the object. The salience of the object is identical, but its associated uses have changed, dramatically changing the !xation distribution characteristics. From Rothkopf et al. (2007).
Figure 6
Figure 6
Scan patterns of three people taking the kettle to the sink in order to fill it prior to making tea (from Land et al., 1999).
Figure 7
Figure 7
The model of Sprague et al. (2007). (A) A virtual agent in a simulated walking environment. The agent must extract visual information from the environment in order to do three subtasks: staying on the sidewalk, avoiding blue obstacles, and picking up purple litter objects (achieved by contacting them). The inset shows the computation for staying on the path. The model agent learns how to deploy attention/gaze at each time step. (B) The agent learns a policy for choosing an action, given the current state information from gaze for a given task. Each action has an associated value, and the agent chooses the option with the highest value. (C) Seven time steps after learning. The agent chooses the task that reduces uncertainty of reward the most. The red lines indicate that the agent is using visual information to avoid the obstacle. The blue line indicates that the agent is using information about position on the sidewalk, and the green lines show the agent using vision to intersect the purple litter object.

References

    1. Bahill AT, Adler D, Stark L. Most naturally occurring human saccades have magnitudes of 15 degrees or less. Investigative Ophthalmology. 1975;14:468–469. - PubMed
    1. Bair W, O'Keefe LP. The influence of fixational eye movements on the response of neurons in area MT of the macaque. Visual Neuroscience. 1998;15:779–786. - PubMed
    1. Ballard DH, Hayhoe MM. Modeling the role of task in the control of gaze. Visual Cognition. 2009;17:1185–1204. - PMC - PubMed
    1. Becker W. The control of eye movements in the saccadic system. Bibliotheca Ophthalmologica. 1972;82:233–243. - PubMed
    1. Becker W. Saccades. In: Carpenter RHS, editor. Vision & visual dysfunction: Eye movements. Vol. 8. Macmillan; Basingstoke, UK: 1991. pp. 95–137.

Publication types