Comparative Study
. 2011 Aug;193(15):3956-63.
doi: 10.1128/JB.00277-11. Epub 2011 May 27.

Comparative genomic analysis of the hexuronate metabolism genes and their regulation in gammaproteobacteria

Affiliations
Comparative Study

Comparative genomic analysis of the hexuronate metabolism genes and their regulation in gammaproteobacteria

Inna A Suvorova et al. J Bacteriol. 2011 Aug.

Abstract

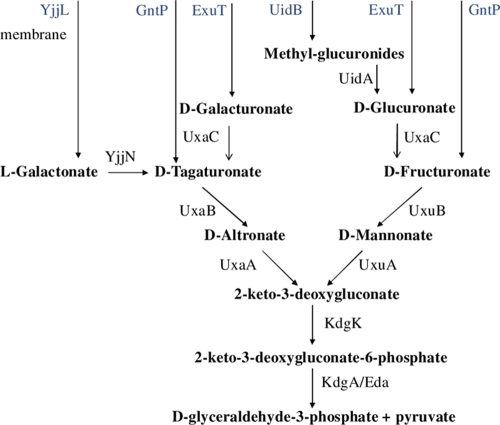
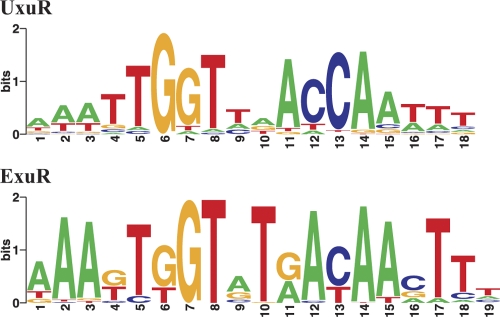
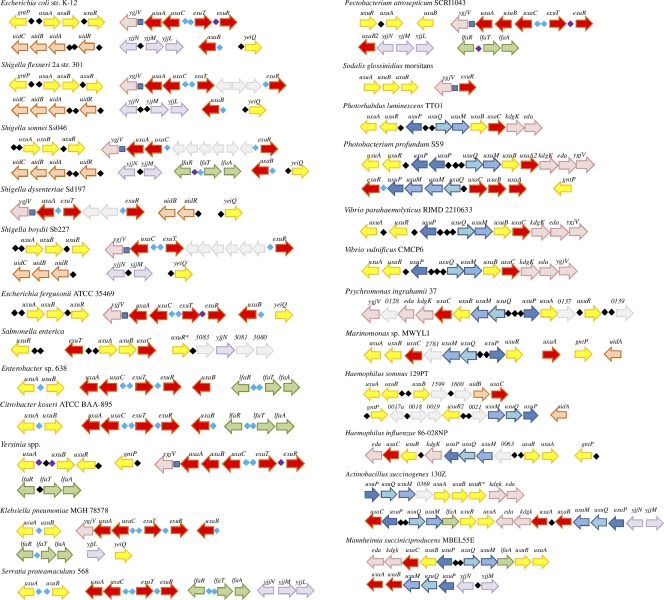
The hexuronate metabolism in Escherichia coli is regulated by two related transcription factors from the FadR subfamily of the GntR family, UxuR and ExuR. UxuR controls the d-glucuronate metabolism, while ExuR represses genes involved in the metabolism of all hexuronates. We use a comparative genomics approach to reconstruct the hexuronate metabolic pathways and transcriptional regulons in gammaproteobacteria. We demonstrate differences in the binding motifs of UxuR and ExuR, identify new candidate members of the UxuR/ExuR regulons, and describe the links between the UxuR/ExuR regulons and the adjacent regulons UidR, KdgR, and YjjM. We provide experimental evidence that two predicted members of the UxuR regulon, yjjM and yjjN, are the subject of complex regulation by this transcription factor in E. coli.


Figures

Fig. 1.
Fig. 1.
Hexuronate metabolism in E. coli. Transport proteins are indicated in blue, and enzymes are indicated in black.
Fig. 2.
Fig. 2.
Phylogenetic tree of the UxuR and ExuR transcription factors from the gammaproteobacteria. Colors: red, UxuR; blue, ExuR; outgroups, black. The “add” denotes a second, additional copy of a TF in the genome. The TF labels correspond to the abbreviations given in Table S1 in the supplemental material.
Fig. 3.
Fig. 3.
Sequence logo for the UxuR and ExuR binding motifs. Horizontal axis, position in the binding site; vertical axis, information content in bits. The height of each column is proportional to the positional information content in the given position; the height of each individual symbol reflects its prevalence at the given position.
Fig. 4.
Fig. 4.
UxuR/ExuR regulon organization in various gammaproteobacteria. UxuR binding sites are indicated as black diamonds, ExuR binding sites are indicated as light blue diamonds, sites predicted to be recognized by both UxuR and ExuR are indicated as violet diamonds, and KdgR binding sites (upstream of ygjV) are indicated as dark blue squares. Numbers denote the locus_tags of unknown genes. Genes are colored according to the locus organization in E. coli.
Fig. 5.
Fig. 5.
Effect of UxuR on the expression of target genes as measured by qPCR. Bars represent the average abundance of the hns (gray), uxuB (blue), yjjM (bright red), yjjN (dark red), and uxuR (green) mRNAs in experimental bacterial cultures compared to the control samples. (A) Relative expression of genes within cells grown in minimal M9 broth, supplemented with 0.2% d-glucose (control sample) or d-glucuronate (experimental culture). Assays indicated by asterisks in four biological replications (8 to 10 technical repeats) vary in the ranges of 250 to 6,900% (yjjM) and 150 to 4,200%. (B and C) Cells transformed by either pGEMU (experimental culture) or pGEM (control sample) were grown in the presence (B) or absence (C) of IPTG and harvested after 4.5 or 5.5 h of cultivation. (B) IPTG (0.1 mM) was added to bacterial cultures after 3.5 h (optical density at 600 nm = 0.4). Induction was allowed for 1 or 2 h, and the cells were harvested as described in panel C. Bars represent average values of changes registered in three independent experiments, with two concentration variables in each experiment. High UxuR-specific bars (see the text) are eliminated from the panels B and C so as to increase the resolution of the plot.
Fig. 6.
Fig. 6.
Correlation in the cellular abundance of the uxuR mRNA with that of the uxuB (left) and yjjM (right) mRNAs. The first-order regression lines are added to trace the points. The Pearson correlation coefficients (R), numbers of available points (n), and corresponding P values are indicated.

References

    1. Altschul S. F., et al. 1997. Gapped BLAST and PSI-BLAST: a new generation of protein database search programs. Nucleic Acids Res. 25:3389–3402 - PMC - PubMed
    1. Barrett T., et al. 2011. NCBI GEO: archive for functional genomics data sets −10 years on. Nucleic Acids Res. 39:D1005–D1010 - PMC - PubMed
    1. Bates-Utz C., Nguyen A. B., Smalley D. J., Anderson A. B., Conway T. 2004. GntP is the Escherichia coli fructuronic acid transporter and belongs to the UxuR regulon. J. Bacteriol. 186:7690–7696 - PMC - PubMed
    1. Benson D. A., et al. 1999. GenBank. Nucleic Acids Res. 27:12–17 - PMC - PubMed
    1. Bernstein J. A., Khodursky A. B., Lin P. H., Lin-Chao S., Cohen S. N. 2002. Global analysis of mRNA decay and abundance in Escherichia coli at single-gene resolution using two-color fluorescent DNA microarrays. Proc. Natl. Acad. Sci. U. S. A. 99:9697–9702 - PMC - PubMed

Publication types

LinkOut - more resources