. 2011 Aug;156(4):1706-24.
doi: 10.1104/pp.111.175570. Epub 2011 May 27.

Differential molecular responses of rice and wheat coleoptiles to anoxia reveal novel metabolic adaptations in amino acid metabolism for tissue tolerance

Affiliations

Differential molecular responses of rice and wheat coleoptiles to anoxia reveal novel metabolic adaptations in amino acid metabolism for tissue tolerance

Rachel N Shingaki-Wells et al. Plant Physiol. 2011 Aug.

Abstract

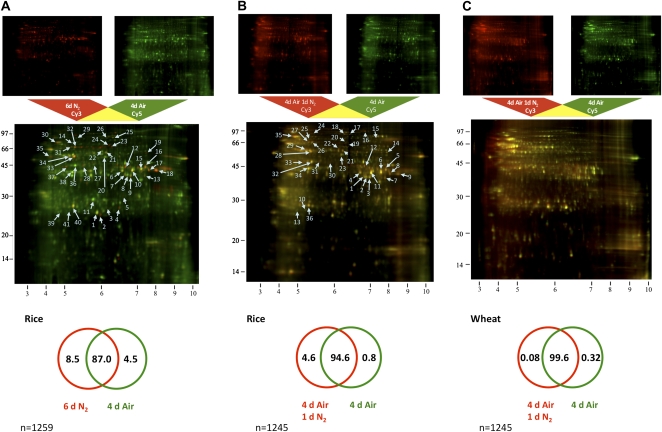
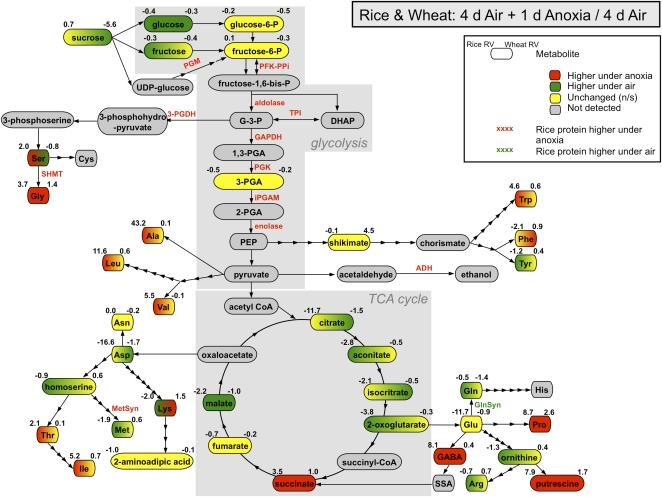
Rice (Oryza sativa) and wheat (Triticum aestivum) are the most important starch crops in world agriculture. While both germinate with an anatomically similar coleoptile, this tissue defines the early anoxia tolerance of rice and the anoxia intolerance of wheat seedlings. We combined protein and metabolite profiling analysis to compare the differences in response to anoxia between the rice and wheat coleoptiles. Rice coleoptiles responded to anoxia dramatically, not only at the level of protein synthesis but also at the level of altered metabolite pools, while the wheat response to anoxia was slight in comparison. We found significant increases in the abundance of proteins in rice coleoptiles related to protein translation and antioxidant defense and an accumulation of a set of enzymes involved in serine, glycine, and alanine biosynthesis from glyceraldehyde-3-phosphate or pyruvate, which correlates with an observed accumulation of these amino acids in anoxic rice. We show a positive effect on wheat root anoxia tolerance by exogenous addition of these amino acids, indicating that their synthesis could be linked to rice anoxia tolerance. The potential role of amino acid biosynthesis contributing to anoxia tolerance in cells is discussed.


Figures

Figure 1.
Figure 1.
DIGE on two-dimensional IEF/SDS gels. A and B, Comparisons were made between coleoptile proteomes of rice seedlings treated with 4 d of aeration versus 6 d of anoxia (A) as well as 4 d of aeration with an additional 1 d under anoxia (B). C, Wheat responses to anoxia were also analyzed by comparing coleoptiles from seedlings treated in the same way as in B. The top panels are gel images of each fluorescence signal, and the bottom panel is a combined image electronically overlaid using ImageQuant TL software (GE Healthcare). Yellowish spots represent proteins of equal abundance between the two samples. The numbered arrows indicate proteins identified by MS (listed in Table II) with abundances that were significantly different between treatments (identified in all nine gel images; P < 0.05; abundance difference > 1.5). Below the DIGE image is a Venn diagram representing the percentage of protein spots significantly changing in abundance between the two treatments. The percentage of protein spots significantly more abundant under anoxia or aeration is shown on the left or right side in each Venn diagram, respectively. The percentage of proteins that did not significantly differ in abundance is shown in the middle.
Figure 2.
Figure 2.
Effect of prolonged anoxia on carbohydrate metabolism, glycolysis, fermentation, amino acid metabolism, and the TCA cycle in rice coleoptiles. Rice seeds were germinated and grown under anoxia for 6 d or aeration for 4 d. The green and red boxes represent metabolites significantly more abundant under aeration and anoxia, respectively (P < 0.05). The yellow boxes represent metabolites whose abundances are unchanged. Enzyme names on arrows are also colored in this fashion. The numbers on the top left side of each box represent the response value (RV) of the corresponding metabolite (anoxic/aerated) in rice coleoptiles. All data were extracted from Tables II and III. Metabolite abbreviations are as follows: DHAP, dihydroxyacetonephosphate; GABA, γ-aminobutyrate; G-3-P, glyceraldehyde-3-phosphate; PEP, phosphoenolpyruvate; 1,3-PGA, 1,3-bisphosphoglycerate; 2-PGA, 2-phosphoglycerate; 3-PGA, 3-phosphoglycerate; SSA, succinic semialdehyde. Protein abbreviations are as follows: ADH, alcohol dehydrogenase; AlaAT, Ala aminotransferase; aldolase, Fru-bisP aldolase; FK, fructokinase; GAPDH, glyceraldehyde-3-phosphate dehydrogenase; GlnSyn, Gln synthetase; iPGAM, 2,3-bisphosphoglycerate-independent phosphoglycerate mutase; MDH, malate dehydrogenase; MetSyn, 5-methyltetrahydropteroyltri-Glu-homo-Cys methyltransferase (cobalamin-independent Met synthase); PDC, pyruvate decarboxylase; PFK-PPi, PPi-Fru-6-P 1-phosphotransferase; 3-PGDH, d-3-phosphoglycerate dehydrogenase; PGK, phosphoglycerate kinase; PGM, phosphoglucomutase; PSAT, phospho-Ser aminotransferase; SHMT, Ser hydroxymethyltransferase; SS, Suc synthase; TPI, triosephosphate isomerase.
Figure 3.
Figure 3.
Effect of a 1-d anoxic switch on carbohydrate metabolism, glycolysis, fermentation, amino acid metabolism, and the TCA cycle in rice and wheat coleoptiles. Rice and wheat seeds were germinated and grown under aeration for 4 d or for 4 d with a switch to 1 d of anoxia. Green or red boxes represent metabolites significantly more abundant during aeration or the anoxic switch, respectively (P < 0.05). The yellow boxes represent metabolites whose abundances are unchanged. Enzyme names that accompany arrows are also colored in this fashion for the rice response only (anoxia-responsive proteins were not identified in wheat). The numbers on the top left and right side of each square represent the response value (RV) of the corresponding metabolite (anoxia/aeration) in rice and wheat coleoptiles, respectively. All data were extracted from Tables II and III. (For abbreviations, see Fig. 2 legend).
Figure 4.
Figure 4.
The effect of exogenous amino acid feeding on cell integrity after prolonged anoxia in wheat and rice seedlings. A, Rice and wheat seeds were germinated and grown under 4 d of aeration. Fresh culture medium in the presence or absence of 10 mm Ala, Ser, and/or Gly was then added to seedlings. Seedlings were returned to 3 d of aeration (green) or transferred to 3 d of anoxia (nonsupplemented in red; supplemented in dark red). Roots were then analyzed using the Evans blue viability stain (n = 3). An increase in cell death is proportional to increased A600. B, Cell membrane permeability in whole rice and wheat seedlings was also analyzed (n = 10–23). This was done by measuring electrical conductivity after seedlings were incubated in distilled, deionized water for 1 h (C1). A second measurement was taken after sample boiling (C2) to obtain the proportion of cell leakage in different samples. Larger C1/C2 values indicate higher electrolyte leakage and thus lower cell integrity. *** P < 0.001, ** P < 0.01, * P < 0.05 when compared with anoxic seedlings that were not supplemented (red bars).

References

    1. Alpi A, Beevers H. (1983) Effects of O2 concentration on rice seedlings. Plant Physiol 71: 30–34 - PMC - PubMed
    1. Atwell B, Waters I, Greenway H. (1982) The effect of oxygen and turbulence on elongation of coleoptiles of submergence-tolerant and -intolerant rice cultivars. J Exp Bot 33: 1030–1044
    1. Bailey-Serres J. (1999) Selective translation of cytoplasmic mRNAs in plants. Trends Plant Sci 4: 142–148 - PubMed
    1. Bailey-Serres J, Chang R. (2005) Sensing and signaling in response to oxygen deprivation in plants and other organisms. Ann Bot (Lond) 96: 507–518 - PMC - PubMed
    1. Bailey-Serres J, Voesenek LACJ. (2008) Flooding stress: acclimations and genetic diversity. Annu Rev Plant Biol 59: 313–339 - PubMed

Publication types

MeSH terms