Comparative Study
. 2011 Aug;301(2):L236-46.
doi: 10.1152/ajplung.00388.2010. Epub 2011 May 27.

Mucous solids and liquid secretion by airways: studies with normal pig, cystic fibrosis human, and non-cystic fibrosis human bronchi

Affiliations
Comparative Study

Mucous solids and liquid secretion by airways: studies with normal pig, cystic fibrosis human, and non-cystic fibrosis human bronchi

Chelsea J Martens et al. Am J Physiol Lung Cell Mol Physiol. 2011 Aug.

Abstract

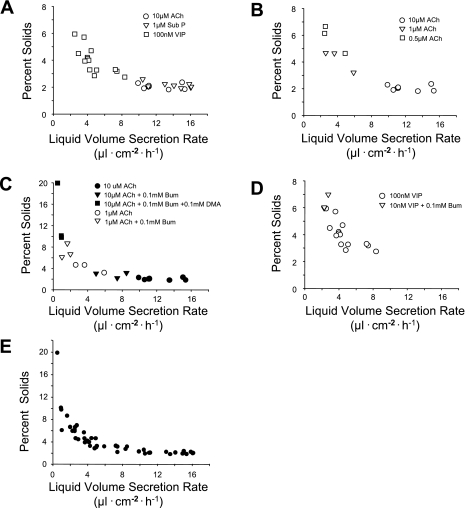
To better understand how airways produce thick airway mucus, nonvolatile solids were measured in liquid secreted by bronchi from normal pig, cystic fibrosis (CF) human, and non-CF human lungs. Bronchi were exposed to various secretagogues and anion secretion inhibitors to induce a range of liquid volume secretion rates. In all three groups, the relationship of solids concentration (percent nonvolatile solids) to liquid volume secretion rate was curvilinear, with higher solids concentration associated with lower rates of liquid volume secretion. In contrast, the secretion rates of solids mass and water mass as functions of liquid volume secretion rates exhibited positive linear correlations. The y-intercepts of the solids mass-liquid volume secretion relationships for all three groups were positive, thus accounting for the higher solids concentrations in airway liquid at low rates of secretion. Predictive models derived from the solids mass and water mass linear equations fit the experimental percent solids data for the three groups. The ratio of solids mass secretion to liquid volume secretion was 5.2 and 2.4 times higher for CF bronchi than for pig and non-CF bronchi, respectively. These results indicate that normal pig, non-CF human, and CF human bronchi produce a high-percent-solids mucus (>8%) at low rates of liquid volume secretion (≤1.0 μl·cm(-2)·h(-1)). However, CF bronchi produce mucus with twice the percent solids (~8%) of pig or non-CF human bronchi at liquid volume secretion rates ≥4.0 μl·cm(-2)·h(-1).


Figures

Fig. 1.
Fig. 1.
Effects of manipulating the rate of liquid volume secretion on percent solids content in pig bronchi. A: effects of 3 neurotransmitters [ACh, substance P (Sub P), and VIP] on liquid secretion rates. B: effects of 0.5, 1, and 10 μM ACh on liquid secretion rates. C: effects of anion transport inhibitors on ACh-induced liquid secretion rates. Bum, bumetanide, an inhibitor of transepithelial Cl secretion; DMA, dimethylamiloride, an inhibitor of transepithelial HCO3 secretion. D: effect of reduced agonist concentration and anion transport inhibition on VIP-induced liquid secretion. E: summary effects of liquid volume secretion rate on percent solids content. Aggregate data from A–D are shown.
Fig. 2.
Fig. 2.
Effects of liquid volume secretion rates on solids mass and water mass secretion rates in pig bronchi. A: secretion rates of solids mass (mg) plotted against liquid volume (μl) secretion rates. Relationship is linear, with slope = 0.013247, y-intercept = 0.107243, and correlation coefficient (r) = 0.917003. Slope of regression line is significantly different from zero (P < 0.05). B: secretion rates of water mass (mg) plotted against liquid secretion rates. Strongly linear relationship has slope = 0.986874, y-intercept = −0.109216, and r = 0.999980. Slope of regression line is significantly different from zero (P < 0.05). C: solids mass secretion rate is not a function of secretagogue concentration in pig bronchi. All bronchi were exposed to 10 μM ACh. Liquid secretion rate was varied by application of bumetanide and DMA to specifically inhibit Cl and HCO3 secretion, respectively. Solids mass secretion rate was positively correlated to liquid volume secretion rate, despite a uniform concentration of ACh. Slope = 0.014109 and y-intercept = 0.083465, which closely match values obtained for aggregate data (A). Correlation coefficient (r) = 0.926874, and slope of data is significantly different (P < 0.05) from zero. D: model line prediction of percent solids from rates of liquid volume secretion in pig bronchi. Aggregate data points from Fig. 1E are shown. Model line is drawn from relationship between rates of solids mass and water mass secretion described by Eq. 5.
Fig. 3.
Fig. 3.
Effects of liquid volume secretion rates on percent solids, solids mass secretion rates, and water mass secretion rates in non-cystic fibrosis (non-CF) human bronchi. A: different rates of liquid secretion were induced with 10 μM ACh or 10 μM forskolin. Bronchi were obtained from idiopathic pulmonary fibrosis patients (○, ●), emphysema patients (□, ■), and donors (▵, ▲). A curvilinear relationship similar to that observed in pig bronchi was observed with higher percent solids at lower rates of liquid secretion. B: secretion rates of solids mass (mg) plotted against liquid volume (μl) secretion rates. Relationship is linear, with slope = 0.029110, y-intercept = 0.051814, and r = 0.770612. Slope of regression line is significantly different from zero (P < 0.05). C: secretion rates of water mass (mg) plotted against liquid secretion rate. Strong linear relationship has slope = 0.972820, y-intercept = −0.056100, and r = 0.999763. Slope of regression line is significantly different from zero (P < 0.05). D: model prediction of percent solids at different liquid volume secretion rates for non-CF human bronchi. Aggregate data from A are shown. Model line is drawn from relationship between rates of solids mass and water mass secretion described by Eq. 8.
Fig. 4.
Fig. 4.
Effects of liquid volume secretion rates on percent solids, solids mass secretion rates, and water mass secretion rates in cystic fibrosis (CF) human bronchi. A: different rates of liquid secretion were induced by treatment with 10 μM ACh or 10 μM forskolin. CFTR mutation status is as follows: ΔF508-ΔF508 (○, ●), ΔF508–3849+10kb C>T (□, ■), and 394delTT-3905insT (▵, ▲). Similar to pig and non-CF human responses, higher percent solids were observed at lower rates of liquid secretion. B: secretion rates of solids mass (mg) plotted against liquid volume (μl) secretion rates. Relationship is linear, with slope = 0.069290, y-intercept = 0.044457, and r = 0.82963. Slope of regression line is significantly different from zero (P < 0.05). C: secretion rates of water mass (mg) plotted against liquid secretion rate. Strong linear relationship has slope = 0.932030, y-intercept = −0.038932, and r = 0.99881. Slope of regression line is significantly different from zero (P < 0.05). D: model prediction of percent solids at different liquid volume secretion rates for CF human bronchi. Data from A are shown. Model line is drawn from relationship between rates of solids mass and water mass secretion described by Eq. 11.
Fig. 5.
Fig. 5.
Comparison of relationship between percent solids and liquid volume secretion for pig, non-CF human, and CF human bronchi. Model lines generated for each group (Figs. 2D, 3D, and 4D) are plotted for comparison.
Fig. 6.
Fig. 6.
Effects of liquid volume secretion rates on biomolecular solids mass secretion rates in pig (A), non-CF human (B), and CF human (C) bronchi. For each sample, extracellular salts mass was subtracted from total solids mass to estimate biomolecular solids mass. A: slope of biomolecular solids mass secretion rate-liquid secretion rate relationship was not significantly different from zero, with r = 0.128326. B: slope of biomolecular solids mass secretion rate-liquid secretion rate relationship was significantly different from zero (P < 0.05), with r = 0.569590. C: slope of biomolecular solids mass secretion rate-liquid secretion rate relationship was significantly different from zero (P < 0.05), with r = 0.772658. Slopes and y-intercepts for the 3 groups of tissues are shown in Table 3.

References

    1. Aikawa T, Shimura S, Sasaki H, Ebina M, Takishima T. Marked goblet cell hyperplasia with mucus accumulation in the airways of patients who died of severe acute asthma attack. Chest 101: 916–921, 1992 - PubMed
    1. Anderson MP, Gregory RJ, Thompson S, Sousa DW, Paul S, Mulligan RC, Smith AE, Welsh MJ. Demonstration that CFTR is a chloride channel by alteration of its anion selectivity. Science 253: 202–205, 1991 - PubMed
    1. Ballard ST, Inglis SK. Liquid secretion properties of airway submucosal glands. J Physiol 556: 1–10, 2004 - PMC - PubMed
    1. Ballard ST, Trout L, Mehta A, Inglis SK. Liquid secretion inhibitors reduce mucociliary transport in glandular airways. Am J Physiol Lung Cell Mol Physiol 283: L329–L335, 2002 - PubMed
    1. Boucher RC, Narvarte J, Cotton C, Stutts MJ, Knowles MR, Finn AL, Gatzy JT. Sodium absorption in mammalian airways. In: Fluid and Electrolyte Abnormalities in Exocrine Glands in Cystic Fibrosis, edited by Quinton PM, Martinez JR, Hopfer U. San Francisco, CA: San Francisco Press, 1982, p. 271–287

Publication types