Comparative Study
. 2011 Jul 1;187(1):92-101.
doi: 10.4049/jimmunol.1100590. Epub 2011 May 27.

Cytotoxic CD4+ T cell responses to EBV contrast with CD8 responses in breadth of lytic cycle antigen choice and in lytic cycle recognition

Affiliations
Comparative Study

Cytotoxic CD4+ T cell responses to EBV contrast with CD8 responses in breadth of lytic cycle antigen choice and in lytic cycle recognition

Heather M Long et al. J Immunol. .

Abstract

EBV, a B lymphotropic herpesvirus, encodes two immediate early (IE)-, >30 early (E)-, and >30 late (L)-phase proteins during its replication (lytic) cycle. Despite this, lytic Ag-induced CD8 responses are strongly skewed toward IE and a few E proteins only, all expressed before HLA I presentation is blocked in lytically infected cells. For comparison, we examined CD4(+) T cell responses to eight IE, E, or L proteins, screening 14 virus-immune donors to overlapping peptide pools in IFN-γ ELISPOT assays, and established CD4(+) T cell clones against 12 defined epitopes for target-recognition assays. We found that the lytic Ag-specific CD4(+) T cell response differs radically from its CD8 counterpart in that it is widely distributed across IE, E, and L Ag targets, often with multiple reactivities detectable per donor and with IE, E, or L epitope responses being numerically dominant, and that all CD4(+) T cell clones, whether IE, E, or L epitope-specific, show strong recognition of EBV-transformed B cell lines, despite the lines containing only a small fraction of lytically infected cells. Efficient recognition occurs because lytic Ags are released into the culture and are acquired and processed by neighboring latently infected cells. These findings suggested that lytic Ag-specific CD4 responses are driven by a different route of Ag display than drives CD8 responses and that such CD4 effectors could be therapeutically useful against EBV-driven lymphoproliferative disease lesions, which contain similarly small fractions of EBV-transformed cells entering the lytic cycle.


Figures

Figure 1
Figure 1
Identification of lytic antigen-specific CD4+ T cell memory responses. Left panels: representative IFNγ Elispot screening results in which ex vivo CD8 T cell-depleted PBMCs were tested for reactivity against overlapping peptides spanning the B95.8 strain sequences of (A) the IE protein BZLF1, E protein BMLF1 and L protein BKRF2 for Donor 2 and (B) the IE protein BRLF1, E protein BMRF1 and L protein BXLF2 for Donor 6. Right panels: Separate IFNγ Elispot assays to map reactivities detected against peptide pools (left panels) to individual peptides comprising the peptide pools. Results are shown as the mean number of spot forming units per 5×10⁵ CD8-depleted PBMCs from duplicate wells for each peptide or pool of peptides tested.
Figure 2
Figure 2
Summary of IFNγ Elispot lytic antigen-specific CD4+ T cell epitope mapping data. (A) 14 healthy EBV-positive donors and one healthy EBV negative donor were analysed for memory CD4+ T cell reactivity to the two E proteins (BZLF1, BRLF1), three E proteins (BHRF1, BMRF1 and BMLF1) and 3 L proteins (BKRF2, BZLF2 and BXLF2). For each donor, reactivity to the different proteins, as detectable by ex vivo IFNγ Elispot assay, is represented as a shaded box. (B) The number of individuals responding to and each of the selected lytic antigens plotted against the size of the proteins. (C) CD4 epitope maps of the selected lytic antigens. Each protein is represented according to its relative size, and epitopes are illustrated as vertical bars. Epitopes against which we subsequently isolated CD4+ T cell clones are identified by an asterisk, of which a previously reported epitope is denoted by a double asterisk (22).
Figure 3
Figure 3
Characterisation of IE, E and L antigen-specific CD4+ T cell clones. Top panel: Autologous and HLA mis-matched allogeneic B95.8 LCLs (5 × 10⁴ per well) were incubated for 1 hour in the presence of 5μM epitope peptide and then washed. Targets were incubated for a further 2 hours in the presence of mAbs to HLA DR (αDR) or HLA DQ (αDQ), or media alone, before the addition of T cells (1000 per well). Bottom panel: T cells were incubated overnight with cells of the autologous B95.8 LCL and of partially HLA class II-matched allogeneic LCLs, for which the matching alleles are shown in each case, all pre-exposed with epitope peptide. All results shown are the mean −/+ 1SD of triplicate wells and are expressed as IFNγ release in nanograms per millilitre, as determined by ELISA.
Figure 4
Figure 4
CD4+ T cell recognition of peptide-loaded and unmanipulated LCL targets. Pairs of B95.8 and BZ k/o LCLs, generated by transformation of PBMCs from the same donor, were either unmanipulated or pre-incubated for 1 hr with 5μM epitope peptide and then washed and used as targets (5 × 10⁴ per well) in overnight co-culture assays with increasing numbers HLA-matched CD4+ and CD8+ T cell clones (500, 1000 and 2500 cells/well). LCL pair 1 expresses HLA-A*02, -DRB1*1501, -DRB3*0201, -DRB5*01 and -DQB1*0301; LCL pair 2 expresses HLA-B*08, -DRB3*0101, -DRB1*0301, -DRB1*1501 and -DRB5*01; and LCL pair 2 expresses HLA-A*02 and -DRB1*08. All results shown are the mean −/+ 1SD of triplicate wells and are expressed as IFNγ release in nanograms per millilitre, as determined by ELISA.
Figure 5
Figure 5
Cytotoxic function of CD4+ T cell clones. (A) Results of 5 hr (left) and 12 hr (right) chromium release assays using clones specific for LTA (BZLF1 61-75), DED (BMLF1 41-55) and LEK (BXLF2 126-145). Targets were paired B95.8 and BZ k/o LCLs that were either unmanipulated or pre-exposed to epitope peptide as in Figure 5. Results are expressed as percentage specific lysis of the target cells at effector:target ratios of 5:1 (■) and 10:1 (formula image). (B) Flow cytometric analyses of intracellular perforin and granzyme B expression in fixed and permeabilised CD4+ T cell clones.
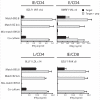
Figure 6
Figure 6
CD4+ T cell recognition of target cell mixtures. CD4+ T cells specific for VKF (BZLF1 11-25), VKL (BMRF1 136-150) and LDL (BLLF1 61-81), and CD8+ T cells specific for RAK (BZLF1 190-197) were simultaneously tested against a pair of B95.8 and BZ k/o LCLs expressing the relevant HLA restricting allele of each clone (HLA-DRB3*0101, -DRB1*0301 and -DRB1*1501 and -B*08), and a mis-matched B95.8 LCL negative for the restricting allele of each clone. In the same assay all T cells were tested for recognition of a 1:1 mixture of the above HLA-matched BZ k/o LCL and HLA-mismatched B95.8 LCL that had been co-cultured for 7 days before the assay (co-culture). Each clone was assayed at 2000 cells/well against 1×10⁵ target cells per well, either unmanipulated or pre-loaded with 5μM epitope peptide as in Figure 5. All results shown are the mean −/+ 1SD of triplicate wells and are expressed as IFNγ release in nanograms per millilitre, as determined by ELISA.
Figure 7
Figure 7
Presentation of late antigens, but not IE or E antigens, is blocked by acyclovir (ACV). CD4+ T cell clones (2000 cells per well) were tested for recognition of the pairs of B95.8 and BZ k/o LCLs used in Figure 5, and in the same assay for recognition of the B95.8 LCL grown for at least 2 weeks in ACV, and the BZ k/o LCL pulsed with purified virus particles at 100MOI. All targets were either unmanipulated or pre-loaded with 5μM epitope peptide and plated at 5×10⁴ cells per well. Results are the mean −/+ 1SD of triplicate wells and are expressed as IFNγ release in nanograms per millilitre, as determined by ELISA.

References

    1. Hislop AD, Taylor GS, Sauce D, Rickinson AB. Cellular responses to viral infection in humans: lessons from Epstein-Barr virus. Annu Rev Immunol. 2007;25:587–617. - PubMed
    1. Gottschalk S, Rooney CM, Heslop HE. Post-transplant lymphoproliferative disorders. Annu Rev Med. 2005;56:29–44. - PubMed
    1. Katz BZ, Raab-Traub N, Miller G. Latent and replicating forms of Epstein-Barr virus DNA in lymphomas and lymphoproliferative diseases. J Infect Dis. 1989;160:589–598. - PubMed
    1. Rea D, Fourcade C, Leblond V, Rowe M, Joab I, Edelman L, Bitker MO, Gandjbakhch I, Suberbielle C, Farcet JP, et al. Patterns of Epstein-Barr virus latent and replicative gene expression in Epstein-Barr virus B cell lymphoproliferative disorders after organ transplantation. Transplantation. 1994;58:317–324. - PubMed
    1. Rickinson A, Kieff E. Epstein-Barr virus. In: Fields B, Knipe D, Howley P, Chanock R, Melnick J, editors. Fields Virology. Lippincott, Williams & Wilkins; Philadelphia: 2007. pp. 2655–2700.

Publication types

MeSH terms

Substances