. 2011 Oct;10(10):M110.005397.
doi: 10.1074/mcp.M110.005397. Epub 2011 May 27.

Proteomics identification of ITGB3 as a key regulator in reactive oxygen species-induced migration and invasion of colorectal cancer cells

Affiliations

Proteomics identification of ITGB3 as a key regulator in reactive oxygen species-induced migration and invasion of colorectal cancer cells

Yunlong Lei et al. Mol Cell Proteomics. 2011 Oct.

Abstract

Colorectal cancer (CRC) is the third most commonly diagnosed cancer in males and second in females worldwide. Unfortunately 40-50% of patients already have metastatic disease at presentation when prognosis is poor with a 5-year survival of <10%. Reactive oxygen species (ROS) have been proposed to play a crucial role in tumor metastasis. We now show that higher levels of ROS accumulation are found in a colorectal cancer-derived metastatic cell line (SW620) compared with a cell line (SW480) derived from the primary lesion from the same patient. In addition, ROS accumulation can affect both the migratory and invasive capacity of SW480 and SW620 cells. To explore the molecular mechanism underlying ROS-induced migration and invasion in CRC, we have compared protein expression patterns between SW480 and SW620 cells using a two-dimensional electrophoresis-based proteomics strategy. A total of 63 altered proteins were identified from tandem MS analysis. Cluster analysis revealed dysregulated expression of multiple redox regulative or ROS responsive proteins, implicating their functional roles in colorectal cancer metastasis. Molecular and pathological validation demonstrated that altered expression of PGAM1, GRB2, DJ-1, ITGB3, SOD-1, and STMN1 was closely correlated with the metastatic potential of CRC. Functional studies showed that ROS markedly up-regulated expression of ITGB3, which in turn promoted an aggressive phenotype in SW480 cells, with concomitant up-regulated expression of STMN1. In contrast, knockdown of ITGB3 expression could mitigate the migratory and invasive potential of SW620 or H(2)O(2)-treated SW480 cells, accompanied by down-regulated expression of STMN1. The function of ITGB3 was dependent on the surface expression of integrin αvβ3 heterodimer. Furthermore, STMN1 expression and the PI3K-Akt-mTOR pathway were found to be involved in ROS-induced and ITGB3-mediated migration and invasion of colorectal cancer cells. Taken together, these studies suggest that ITGB3 plays an important role in ROS-induced migration and invasion in CRC.


Figures

Fig. 1.
Fig. 1.
ROS promotes the proliferation and migration of SW480 cells. A, Representative fluorescence images showing intracellular ROS levels of SW480 and SW620 detected by staining cells with 2′,7′-dichlorofluorescein diacetate. B, Intracellular ROS in SW480 and SW620 cells measured using a Molecular Devices SPECTRAMAX M5 fluorimeter (490 nm excitation and 530 nm emission). The x axis shows the average value of three independent experiments (each experiment had at least three triplicates). C, Intracellular ROS in SW480 and SW620 treated with or without H2O2 or/and NAC were measured using a Molecular Devices SPECTRAMAX M5 fluorimeter. D, A confluent monolayer was wounded with a sterile pipet tip and SW480 and SW620 cells, with or without H2O2 or/and NAC treatment, were allowed to migrate for 72 h before analysis. Dashed lines indicate the original wound boundaries. E, Representative photographs of soft agar colony formation 14 days after culture of cells, with mean colony counts from three independent experiments indicated below. F and G, The number of migrated and invaded SW480 (F) or SW620 (G) cells from five random fields were counted and presented with relative cell numbers. Migration proceeded for 24 h, while invasion was measured after 72 h. 0, untreated cells; H2O2, H2O2-treated cells; NAC, NAC treated cells. (*) p < 0.05; (**) p < 0.01. All data were from at least three independent experiments and are shown as mean ± S.D.
Fig. 2.
Fig. 2.
Proteomic analysis of SW480 and SW620 protein expression. A, Representative two-dimensional gel images of human colorectal cancer cell lines SW480 and SW620. Total protein extracts were separated on pH 3–10 nonlinear immobilized pH gradient strips in the first dimension followed by 12% SDS-PAGE in the second dimension and visualized by CBB staining. B, Reference maps were generated from Fig 2A using PDQuest software. Sixty-three differentially expressed spots (28 up-regulated in SW480, 35 up-regulated in SW620) were identified (as numbered). Details for each numbered spot are reported in Table II. C, Sixty-three identified proteins were classified into 11 groups. These included metabolism (26%), redox regulation (9%), cell motion (6%), signal transduction (11%), and cell cytoskeleton (5%). D, These proteins were found to be located in the cytoplasm (64%), nucleus (16%), mitochondrion (9%), cell membrane (10%), or secreted (1%). (E and F) In silico protein interaction analysis. Regulated proteins involved in redox regulation or ROS signaling were analyzed for protein interactions using the web based software tool STRING, without (E) or with (F) addition of MAPK and AKT, which are critical kinases in ROS signaling.
Fig. 3.
Fig. 3.
The differential expression of PGAM1, GRB2, DJ-1, ITGB3, SOD1 and STMN1. A, Enlargement of selected regions in Fig. 2A. Spots selected are PGAM 1 (Spot 39), DJ-1(Spot 54), GRB2 (Spot 45), ITGB3 (Spot 1), SOD1 (Spot 61), and STMN1 (Spot 56). B, Relative expression of PGAM1, GRB2, DJ-1, ITGB3, SOD1, and STMN1. Each gel spot was quantified using PDQuest 2-DE software. C, The relative expression of PGAM1, GRB2, DJ-1, ITGB3, SOD1, and STMN1 in SW480 and SW620 cells was further validated by Western blot analysis. β-actin was used as a loading control. D, Bands were analyzed by densitometry using Quality-One software (Bio-Rad laboratories, Richmond, CA). The x axis shows the average intensity from four individual experiments. Data is presented as mean ± S.D.
Fig. 4.
Fig. 4.
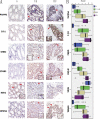
The relevance between the altered protein expression and tumor stage in CRC. A, Representative immunostaining of PGAM1, DJ-1, GRB2, ITGB3, SOD-1, and STMN1. N, normal colonic mucosa; TII, Stage II; and TIV, Stage IV. Positive staining is indicated by red arrows. B, SPPS immunohistochemical scores for PGAM1, DJ-1, GRB2, ITGB3, SOD-1, and STMN1 in normal colonic mucosa, stage I and II, stage III, and stage IV CRC. The average immunoreactivity scores of PGAM1, GRB2, DJ-1, ITGB3, STMN1 were significantly higher in cancer tissues than in normal tissues (One-way ANOVA analysis, p < 0.001). In contrast, SOD1 was markedly lower in cancer tissues than in normal tissues. In addition, the average immunoreactivity scores of the six ROS-related proteins was significantly correlated with surgical-pathological stage (p < 0.05).
Fig. 5.
Fig. 5.
ITGB3 depletion attenuates ROS-induced migration and invasion in SW480 cells. A, Western blot analysis of SW480 and SW620 cells in the presence (+) or absence (-) of H2O2 and NAC. Blots were probed with anti ITGB3 and STMN1 antibodies (see Materials and Methods). Actin was used as a loading control. B, Immunofluorescent detection of ITGB3 on the surface of SW480 and SW620 treated with or without H2O2 or/and NAC. (C–F) For the following experiments H2O2-treated SW480 cells were transfected with siRNA-ITGB3 (H2O2+siITGB3) or a negative control siRNA (NC+siITGB3). Cells treated with lipofectamine RNAiMAX alone were used as mock control (H2O2) and SW480 cells transfected with siRNA-ITGB3 were used as a function control (siITGB3). C, Wound healing assay. Photographs were taken at 72 h postwounding. Dashed lines indicated the original wound boundaries. D, Soft agar colony formation. Mean colony counts from three independent experiments at shown below. ITGB3 knockdown prevented colony formation in H2O2-treated SW480 cells. Photographs were taken after 2 weeks. E, Cell migration and matrigel invasion assays. Migration proceeded for 24 h, whereas invasion was analyzed after 72 h. (*) p < 0.05; (**) p < 0.01. All data were from at least three independent experiments and are shown as mean ± S.D. F, Western blot analysis showing expression of ITGB3 and STMN1 in ITGB3-siRNA-transfected, NC-transfected, and mock control cells.
Fig. 6.
Fig. 6.
ITGB3 promotes an aggressive cancer phenotype in colorectal cancer cells. siRNA-ITGB3 (siITGB3) and the negative control siRNA (NC) were transfected into highly metastatic SW620 cells. Cells treated with lipofectamine RNAiMAX alone were used as a control (Mock). Meanwhile, ITGB3 was consistently overexpressed in SW480 cells, whereas the empty vector was used as control. A, Wound healing model. Dashed lines indicated the original wound boundaries. Data were analyses at 72 h postwounding. B, Soft agar colony formation. Data were analyzed after 2 weeks. Mean colony counts at the bottom were from three independent experiments. C, Quantitative analysis of cell migration and matrigel invasion assays. Migration was proceed for 24 h, whereas invasion was 72 h. (*) p < 0.05; (**) p < 0.01. All data were from at least three independent experiments and shown as mean ± S.D. D, Western blot analysis of ITGB3 and STMN1 expression.
Fig. 7.
Fig. 7.
αvβ3 expression is necessary in ROS-ITGB3-induced migration and invasion of colorectal cancer cells. (A) and (B) immunofluorescent detection of αvβ3 expression on surface of SW480 (A) and SW620 (B) cells treated with or without H2O2, ITGB3, NAC, and/or siITGB3. C, Migration of H2O2-treated and ITGB3-overexpression SW480 toward fibrinogen in the presence of integrin αvβ3 antibody (LM609, 10 μg/ml) or control antibody (mouse IgG, 10 μg/ml). D, Migration of SW620 cells to fibrinogen in the presence of NAC or LM609. E, LM609 blocked the increased invasive ability of SW480 cells induced by H2O2 or ITGB3. F, LM609 decreased the invasive ability of SW620. Migration was allowed to proceed for 24 h, whereas invasion was 72 h. 0, untreated cells; H2O2, H2O2-treated cells; NAC, NAC treated cells. (*) p < 0.05; (**) p < 0.01. All data were from at least three independent experiments and shown as mean ± S.D.
Fig. 8.
Fig. 8.
STMN1 expression is important in ROS-ITGB3-induced migration and invasion of colorectal cancer cells. siRNA-STMN1 (siSTMN1) and the negative control siRNA (NC) were transfected into H2O2-treated and ITGB3-overexpression SW480 cells as well as SW620 cells. A, Wound healing model. Dashed lines indicated the original wound boundaries. Data were analyses at 72 h postwounding. B, Soft agar colony formation. Data were analyzed after 2 weeks. Mean colony counts at the bottom were from three independent experiments. C, Quantitative analysis of cell migration and matrigel invasion assays. Migration was proceed for 24 h, whereas invasion was 72 h. (*) p < 0.05; (**) p < 0.01. All data were from at least three independent experiments and shown as mean ± S.D. D, The expression of STMN1 in cells transfected with or without siSTMN1.
Fig. 9.
Fig. 9.
Akt-mTOR and p38 MAPK signaling pathways are involved in ROS-ITGB3-induced migration and invasion of colorectal cancer cells. The phosphorylation status of Akt, mTOR and p38 MAPK in SW480 cells treated with H2O2, ITGB3, or a combination of H2O2 and siITGB3 was measured by Western blot analysis. Details of antibodies used are given in Materials and Methods. Actin was used as a loading control.
Fig. 10.
Fig. 10.
Schematic illustrating the potential role of integrin β3 (ITGB3) in ROS-induced migration and invasion of colorectal cancer cells. The accumulation of ROS could up-regulate the expression integrin β3, which may alter the expression of the αvβ3 integrin heterodimers. This change may increase the activity of proliferation, migration, and invasion of colorectal cancer cells directly or by activating the downstream targets such as STMN1 through PI3K or MAPK pathways. Integrin signaling is predominantly initiated through the recruitment of focal adhesion complexes, which are composed of integrins, Src-family kinases (SFKs), and focal adhesion kinase. SOD-1 is an antioxidase that can reduce the accumulation of ROS. GRB2 is an important adaptor protein in integrin signaling. DJ-1 is a suppressor of PTEN, which antagonizes PI3K-Akt pathway. ECM, extracellular matrix.

Similar articles

Cited by

References

    1. Saif M. W. (2006) Targeted agents for adjuvant therapy of colon cancer. Clin. Colorectal Canc. 6, 46–51 - PubMed
    1. Etzioni R., Urban N., Ramsey S., McIntosh M., Schwartz S., Reid B., Radich J., Anderson G., Hartwell L. (2003) The case for early detection. Nat. Rev. Cancer 3, 243–252 - PubMed
    1. Chambers A. F., Groom A. C., MacDonald I. C. (2002) Dissemination and growth of cancer cells in metastatic sites. Nat. Rev. Cancer 2, 563–572 - PubMed
    1. Davies R. J., Miller R., Coleman N. (2005) Colorectal cancer screening: prospects for molecular stool analysis. Nat. Rev. Cancer 5, 199–209 - PubMed
    1. Poli G., Leonarduzzi G., Biasi F., Chiarpotto E. (2004) Oxidative stress and cell signalling. Curr. Med. Chem. 11, 1163–1182 - PubMed

Publication types

MeSH terms