. 2011 May 29;14(7):824-6.
doi: 10.1038/nn.2828.

Synaptic vesicle retrieval time is a cell-wide rather than individual-synapse property

Affiliations

Synaptic vesicle retrieval time is a cell-wide rather than individual-synapse property

Moritz Armbruster et al. Nat Neurosci. .

Abstract

Although individual nerve terminals from the same neuron often differ in neurotransmitter release characteristics, the extent to which endocytic retrieval of synaptic vesicle components differs is unknown. We used high-fidelity optical recordings to undertake a large-scale analysis of endocytosis kinetics of individual boutons in hippocampal rat neurons. Our data indicate that endocytosis kinetics do not differ substantially across boutons from the same cell but instead appear to be controlled at a cell-wide level.


Figures
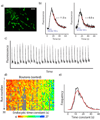
Figure 1
Figure 1
A) Representative field of synaptic boutons transfected with vG-pH. Scale bar 10µm. B) example traces with exponential fits to the fluorescence decays of a single bouton stimulated with 100AP 10Hz stimulus. Decay times are 11.5 ±0.5 s and 6.6 ±0.4 s respectively. C) exo-endocytic responses from 29 consecutive runs from a single bouton with 5 min recovery between runs. D) Heat map of all endocytic decays of an individual cell, color-coded from 4s (red) to 27s (blue), with grey being events that did not pass inclusion criteria. Boutons are sorted from fastest (left) to slowest (right); while runs are from first (top) to last (bottom). (29 runs, 46 boutons, 1136 events, average time constant 9.2s ± 0.1s). E) Histogram of all 832 bouton events from a single cell plotted with the maximum-likelihood fit of the Markov model (Histogram (black) mean <τendo>= 14.50 s, Model (red) mean <τendo>= 15.22 s, N=19 vesicles).
Figure 2
Figure 2
A) Heat maps of 3 different cells (truncated to 18 runs (top to bottom) and 20 boutons each). Grey represents bouton-events that did not meet inclusion criteria. (Average τendo 20.7±0.3s, 6.3±0.1s, 15.7±0.3s) B) <τendo> distribution across cells shows a range from 5.5s – 39.8s (N=84 cells) C) Distribution and <τendo> of WT, AP2-KD, vGlut-positive, vGlut-positive TTX silenced, vGat-positive and vGat-positive TTX silenced cells based upon post-experiment immunofluorescence staining. Normalizing the distributions to their mean showed that there is no significant difference in the spread of the distribution for AP2-KD cells compared to WT (KS-test p=0.29). Silencing cultures with TTX for 2–8 days showed no significant difference in their distributions (KS-test p=0.24 vGlut, p=0.69 vGat). vGlut, vGat segregation showed no significant difference in their distributions (KS-test p=0.28). (Box-whisker plots showing 5%–25%–50%– 75%–95%) is plotted. (WT N= 84, AP2-KD N=14, vGlut N=10, vGlut-TTX N=14, vGat N=16, vGat-TTX N=11 cells) Cell averaged time constants WT 12.3±0.6s, AP2-KD 35.3±5.3s, vGlut 13.4±0.8s, vGlut-TTX 14.3±1.5s, vGat 13.4±0.9s, and vGat-TTX 12.4±0.9s.

References

    1. Granseth B, Odermatt B, Royle SJ, Lagnado L. Neuron. 2006;51:773–786. - PubMed
    1. Kim SH, Ryan TA. J Neurosci. 2009;29:3865–3874. - PMC - PubMed
    1. Koenig JH, Ikeda K. J Neurobiol. 1983;14:411–419. - PubMed
    1. Newton AJ, Kirchhausen T, Murthy VN. PNAS. 2006;103:17955–17960. - PMC - PubMed
    1. Ferguson SM, et al. Science. 2007;316:570–574. - PubMed

Publication types

MeSH terms