. 2011 May 29;43(7):656-62.
doi: 10.1038/ng.846.

An integrated approach to characterize genetic interaction networks in yeast metabolism

Affiliations

An integrated approach to characterize genetic interaction networks in yeast metabolism

Balázs Szappanos et al. Nat Genet. .

Abstract

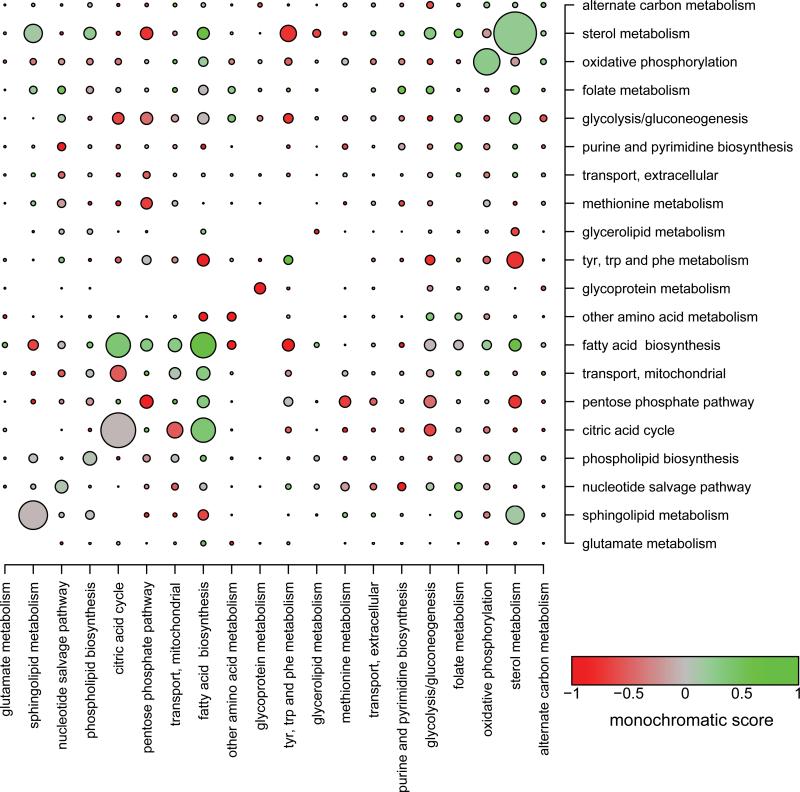
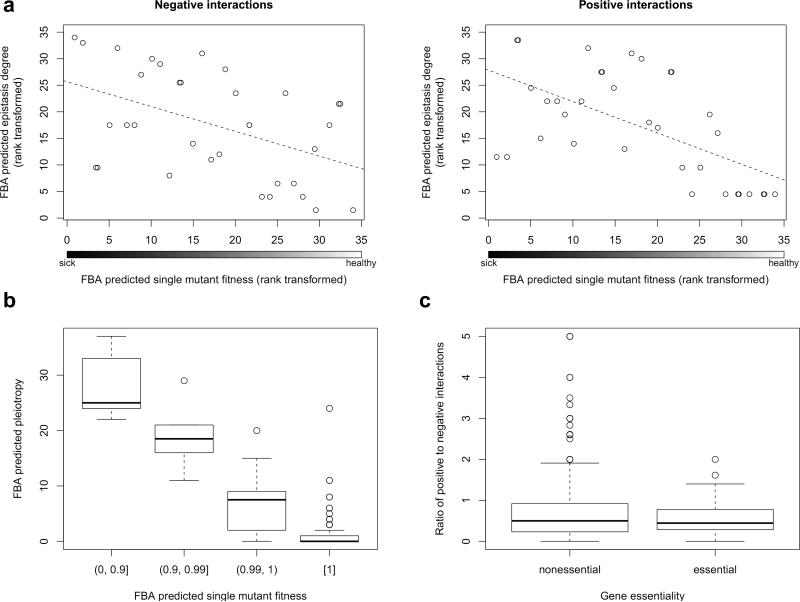
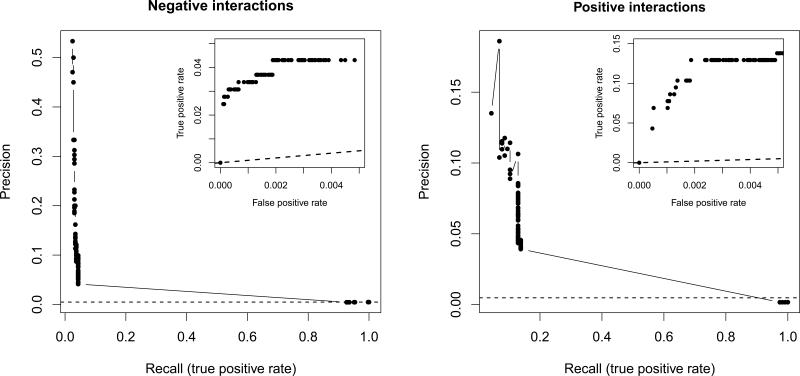
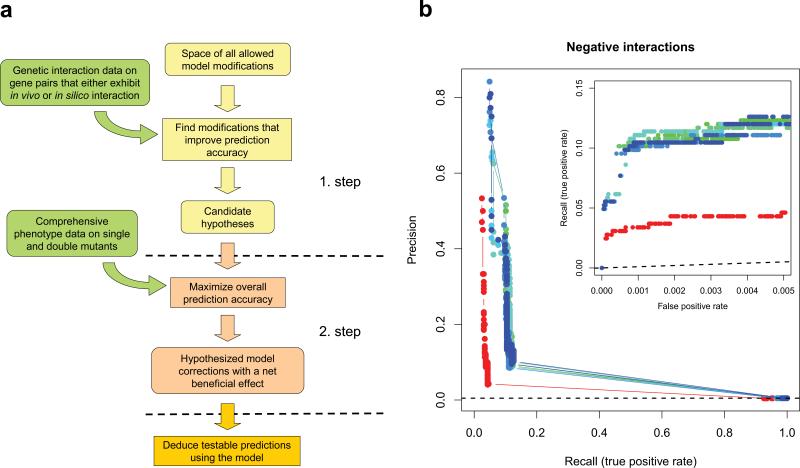
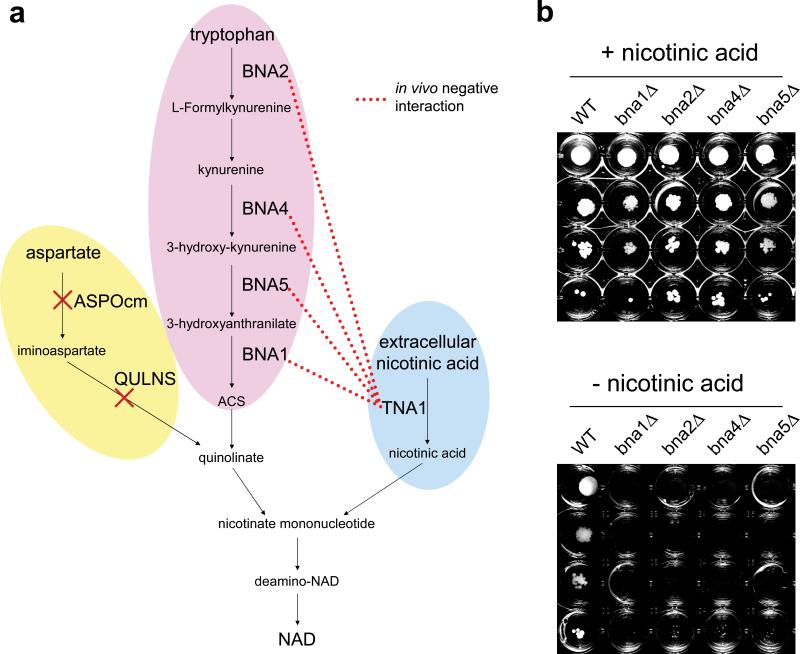
Although experimental and theoretical efforts have been applied to globally map genetic interactions, we still do not understand how gene-gene interactions arise from the operation of biomolecular networks. To bridge the gap between empirical and computational studies, we i, quantitatively measured genetic interactions between ∼185,000 metabolic gene pairs in Saccharomyces cerevisiae, ii, superposed the data on a detailed systems biology model of metabolism and iii, introduced a machine-learning method to reconcile empirical interaction data with model predictions. We systematically investigated the relative impacts of functional modularity and metabolic flux coupling on the distribution of negative and positive genetic interactions. We also provide a mechanistic explanation for the link between the degree of genetic interaction, pleiotropy and gene dispensability. Last, we show the feasibility of automated metabolic model refinement by correcting misannotations in NAD biosynthesis and confirming them by in vivo experiments.


Figures

Figure 1
Figure 1
Distribution and monochromaticity of genetic interactions between functional groups. The radii of the circles represent the fraction of screened gene pairs that show genetic interaction within and between functional annotation groups (e.g. sterol metabolism has the highest prevalence of interactions with a value of 0.225). Enrichment of genetic interactions within functional groups is visually apparent and corresponds to larger circles on the diagonal. The colors of the circles reflect the monochromatic score defined as the normalized ratio of positive to all interacting pairs (see Online Methods). Functional groups displaying only positive genetic interactions between each other have a monochromatic score of +1 (green), while those interacting purely negatively have a score of -1 (red). The background ratio of positive to all interactions (0.348) corresponds to a score of 0 (grey). Only the top 20 functional groups with the largest number of screened gene pairs and those genes assigned to only one functional group are included in the plot.
Figure 2
Figure 2
Degree distribution of genetic interaction networks and gene dispensability. (a) Both negative and positive genetic interaction degrees predicted by FBA show negative correlations with predicted single-mutant fitness. Only genes exhibiting non-zero in silico fitness defects are shown and variables are rank transformed. See Online Methods for details on selecting independent data points (genes) for the statistical analysis. To improve the visual representation of coincident data points, we added a small amount of noise over the x-axis for plotting. (b) The FBA-predicted single-gene deletion effect is strongly associated with predicted system-level pleiotropy degree (i.e. the number of biosynthetic processes to which a gene contributes). See Online Methods for details on the gene selection procedure. (c) Comparison of the empirically determined positive to negative genetic interaction ratio between null mutants of non-essential genes and hypomorphic alleles of essential genes reveals no significant difference. Horizontal lines of the boxplots correspond to the medians, the bottoms and tops of the boxes show the 25th and 75th percentiles, respectively. Whiskers show either the maximum (minimum) value or 1.5 times the interquartile range of the data, whichever is smaller (higher). Points more than 1.5 times the interquartile range above the third quartile or below the first quartile are plotted individually as outliers.
Figure 3
Figure 3
Comparison of computationally predicted and empirically determined genetic interactions. Prediction accuracy evaluated by visualizing the trade-off between precision (fraction of predicted interactions that are supported by empirical data) and recall (fraction of empirical interactions that are successfully identified by the model), and true-positive and false-positive rates (partial ROC curves, inset) at different in silico genetic interaction score cut-offs. Dashed lines represent the levels of discrimination expected by chance. Note the different scale of the y-axes for negative and positive interactions.
Figure 4
Figure 4
Automated model refinement procedure. (a) Workflow of the two-stage model refinement method. In the first stage, a coarse-grained search is executed where candidate models are evaluated only for those gene pairs that display interaction either in vivo or in silico, according to the original model. In the second stage, the best models are refined in a restricted search space that is based on the results of the first stage, but now using all available data to evaluate the models. This two-stage approach made it feasible to explore a large space of candidate hypotheses while also making use of all available phenotypic data. (b) Results of 8 independent runs of the model refinement algorithm. Fits of the modified (blue – green) and unmodified original (red) models to our empirical genetic interaction data are visualized by both precision-recall and partial ROC curves (inset). Dashed lines represent the levels of discrimination expected by chance. Note that the same empirical dataset was used for both model refinement and model evaluation, i.e. no unseen test data was used to generate these plots. For a cross-validation estimate of model improvement see main text and Supplementary Note.
Figure 5
Figure 5
Automated model refinement suggests modifications in NAD biosynthesis. (a) Biosynthetic routes to nicotinate mononucleotide in the yeast metabolic network reconstruction. Genes involved in the de novo pathway from tryptophan show negative genetic interactions with the nicotinic acid transporter gene in vivo, but not in silico due to the presence of a two-step biosynthetic route from aspartate to quinolinate in the reconstruction (ASPOcm, aspartate oxidase; QULNS, quinolinate synthase). (b) Experimental verification of suggested model modifications. Deletion of genes for kynurenine pathway enzymes causes nicotinic acid auxotrophy. Strains deleted for the genes of the kynurenine pathway (bna1Δ bna2Δ bna4Δ, and bna5Δ) along with wild type (WT) were spotted in four serial dilutions on solid SC-His/Arg/Lys medium and incubated at 30 °C for 48 hours in the presence and absence of nicotinic acid as indicated. To prevent diffusion of any substances that would complement nicotinic acid auxotrophy, the strains were grown separately from each other in a 24-well plate. Repeating the experiment using liquid media confirmed the nicotinic acid auxotrophy of the mutants (data not shown). Yeast strains used in the auxotrophy study are derivatives of the BY4741 yeast deletion collection,.

References

    1. Costanzo M, et al. The genetic landscape of a cell. Science. 2010;327:425–31. - PMC - PubMed
    1. Schuldiner M, et al. Exploration of the function and organization of the yeast early secretory pathway through an epistatic miniarray profile. Cell. 2005;123:507–19. - PubMed
    1. Collins SR, et al. Functional dissection of protein complexes involved in yeast chromosome biology using a genetic interaction map. Nature. 2007;446:806–10. - PubMed
    1. Tong AH, et al. Global mapping of the yeast genetic interaction network. Science. 2004;303:808–13. - PubMed
    1. Feist AM, Herrgard MJ, Thiele I, Reed JL, Palsson BO. Reconstruction of biochemical networks in microorganisms. Nat Rev Microbiol. 2009;7:129–43. - PMC - PubMed

Publication types

MeSH terms

Substances