. 2011 May 30:5:88.
doi: 10.1186/1752-0509-5-88.

Systematic quantitative characterization of cellular responses induced by multiple signals

Affiliations

Systematic quantitative characterization of cellular responses induced by multiple signals

Ibrahim Al-Shyoukh et al. BMC Syst Biol. .

Abstract

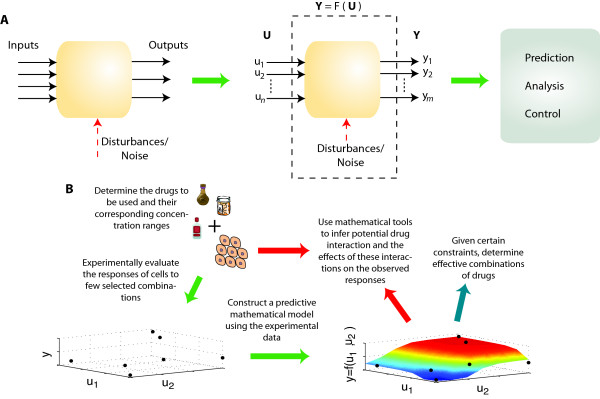
Background: Cells constantly sense many internal and environmental signals and respond through their complex signaling network, leading to particular biological outcomes. However, a systematic characterization and optimization of multi-signal responses remains a pressing challenge to traditional experimental approaches due to the arising complexity associated with the increasing number of signals and their intensities.

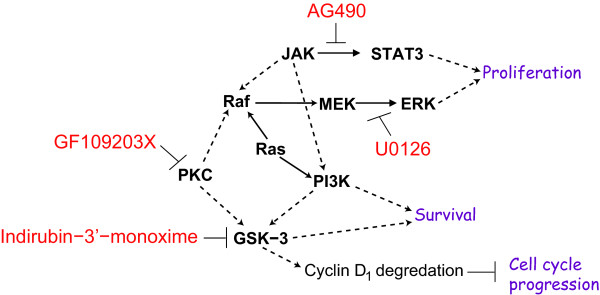
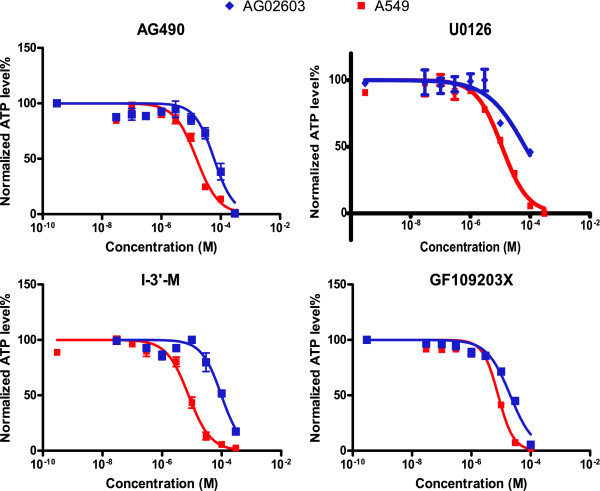
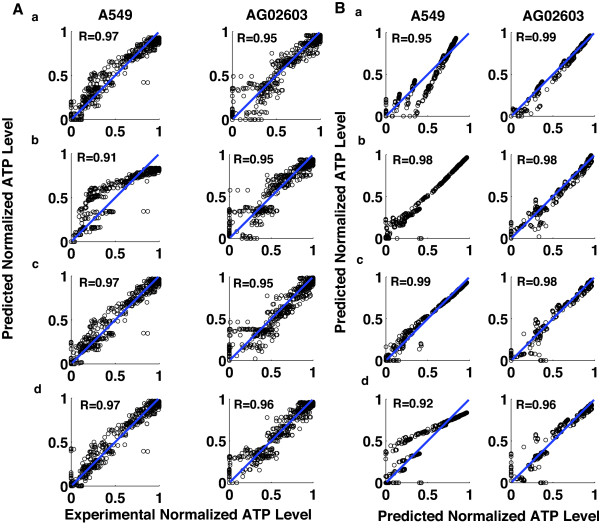
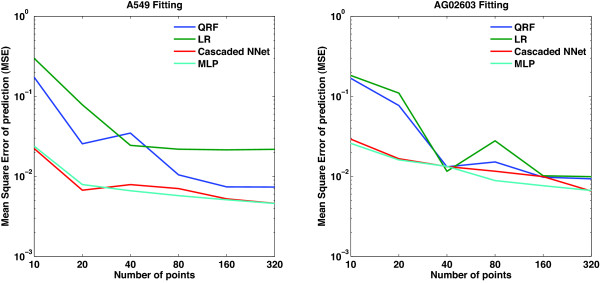
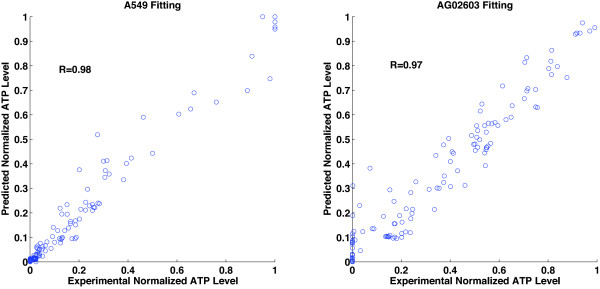
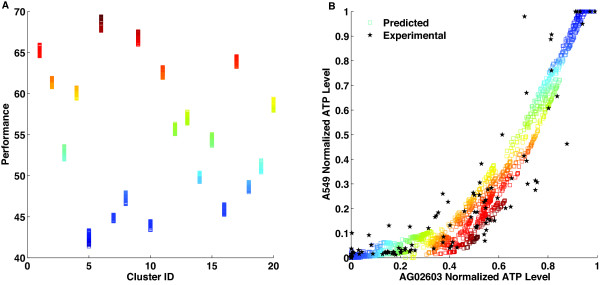
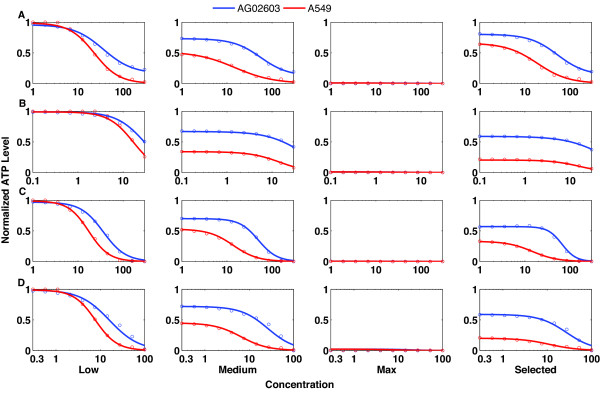
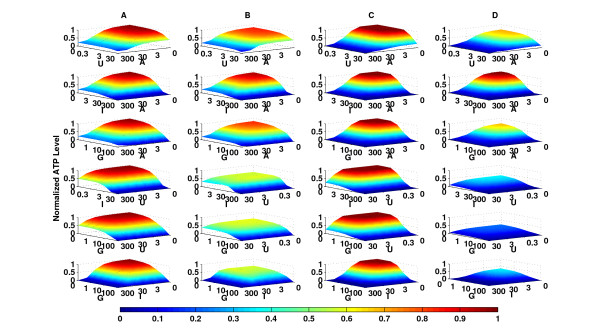
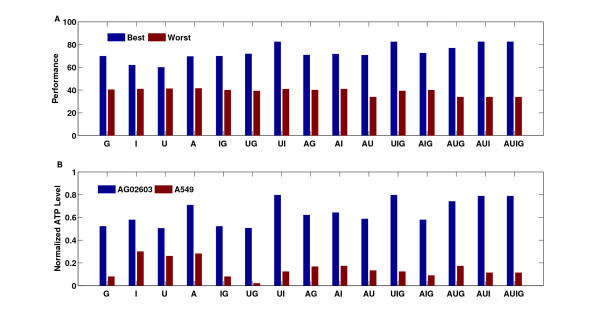
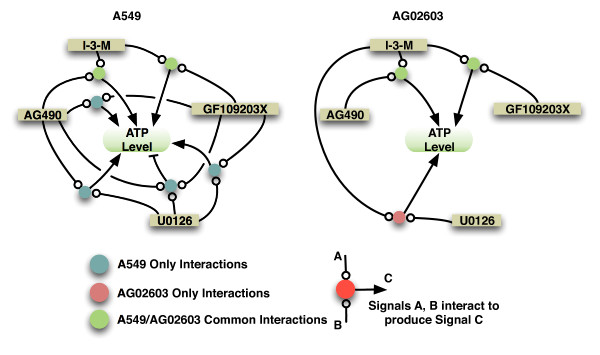
Results: We established and validated a data-driven mathematical approach to systematically characterize signal-response relationships. Our results demonstrate how mathematical learning algorithms can enable systematic characterization of multi-signal induced biological activities. The proposed approach enables identification of input combinations that can result in desired biological responses. In retrospect, the results show that, unlike a single drug, a properly chosen combination of drugs can lead to a significant difference in the responses of different cell types, increasing the differential targeting of certain combinations. The successful validation of identified combinations demonstrates the power of this approach. Moreover, the approach enables examining the efficacy of all lower order mixtures of the tested signals. The approach also enables identification of system-level signaling interactions between the applied signals. Many of the signaling interactions identified were consistent with the literature, and other unknown interactions emerged.

Conclusions: This approach can facilitate development of systems biology and optimal drug combination therapies for cancer and other diseases and for understanding key interactions within the cellular network upon treatment with multiple signals.


Figures

Figure 1
Figure 1
Summary of approach. (A) The proposed approach uses input-output data to generate mathematical models capable of predicting the cellular responses to input combinations. The models enable using other mathematical tools for analyzing the cellular responses and for selecting the appropriate combinations of the input signal to drive the system to respond favorably. (B) The desired drugs are combined in certain concentrations and a few combinations are chosen and evaluated experimentally. A predictive mathematical model is generated that can predict the response to all possible combinations. The model can be used to analyze and predict drug interactions and their effects on the observed cellular response and can also be used to determine effective combinations.
Figure 2
Figure 2
Simplified pathway and drug interactions. Shown are simplified pathways targeted in the three and four-drug combination treatment of nonsmall cell lung cancer cells A549 and primary fibroblast AG02603 cells that are already known or reported. The dashed arrows indicate indirect connections.
Figure 3
Figure 3
Single-drug dose response curves. Shown are the experimental single-drug dose response curves for the four drugs used in the study. The data was used to identify the drug concentrations to be used in combination studies.
Figure 4
Figure 4
Three-drug model fitting. The figure shows an evaluation of modeling the responses of A549 and AG02603 to combinations of three drugs. (A) The panels show a plot of the model predicted cellular ATP levels versus the experimentally measured values. Cellular ATP-level predictive models for A549 and AG02603 cells were developed using a number of different methods. a. A linear regression model that uses pairwise products of concentrations and quadratic terms (QRF). b. A linear regression model with n-wise products of concentrations (LR). c. A cascaded neural network with two single-neuron layers (Cascaded NNet). d. A four-neuron single layer multi-layer perceptron artificial neural network (MLP). The models are based on fitting 80 out of 512 combinations and the figure shows the predicted versus experimental values for all 512 combinations. The correlation between the experimentally tested cellular ATP-level (x-axis) and the predicted cellular ATP-level (y-axis) is shown. The circles in the graphs represent individual data points. The diagonal line represents a perfect fit between the experimental and predicted data. (B) Comparison between the predicted normalized ATP levels of different models. The predicted ATP levels for different models are plotted against each other. a. QRF versus LR. b. Cascaded NNet versus MLP. c. QRF versus MLP. d. LR versus MLP. The correlation coefficients between the different methods are shown.
Figure 5
Figure 5
Model accuracy as a function of modeling method and data size. The figure shows the effects of using different sizes of data sets for fitting the models and the effects on the model accuracy as measured by the mean square error of prediction. The mean square error of predicted data using four different methods and using 10, 20, 40, 80, 160, and 320 data points, for both A549 and AG02603 cells are displayed. The four methods are two linear regression methods and two neural network methods. The linear regression methods include one that uses pairwise products of concentrations and quadratic terms of the concentrations (QRF), and the other uses the n-wise products of concentrations of drugs as interaction terms (LR). The two neural network methods are a cascaded neural network with two single-neuron layers, and a four-neuron single-layer multi-layer perceptron (MLP). As the number of points used to generate the model increases, the mean square error decreases.
Figure 6
Figure 6
Four-drug model fitting. The figure shows the model-predicted ATP-levels versus the experimentally obtained values for four drugs combinations. The model used is a four neuron single layer neural network model that was fitting using a data set of size 148 out of 2401 combinations. The correlation between the experimentally tested cellular ATP-level (x-axis) and the predicted cellular ATP-level (y-axis) is shown. The circles in the graphs represent individual data points. The diagonal line represents a perfect fit between the experimental and predicted data.
Figure 7
Figure 7
Analysis of drug combination differential responses. The figure presents the analysis results to identify combinations of drugs that can maximize a performance function reflecting the desired objective of minimizing the killing of AG02603 cells and maximizing the killing of A549 cels (see methods section for the details on the performance functions. (A) Results of k-means clustering analysis of the performance of four-drug combinations. Points are grouped together to minimize the distance to the mean of that group. Each group is given a identification number (ID). The x-axis shows cluster IDs; the y-axis shows the performance score of each drug combination. The heat map is a function of the performance for each point. (B) Cell ATP-level (x-axis: AG02603; y-axis: A549) upon four-drug combination treatments. The red stars represent the experimentally tested 148 drug combinations. The squares represent the whole set of 2401 possible drug combinations with the heat map colors reflecting the performance of each combination.
Figure 8
Figure 8
Single-drug response curves. The figure shows an evaluation of the model-predicted ATP-levels of A549 and AG02603 when the concentrations of three drugs are held constant while the concentration of the fourth drug is varied. The values of the concentration at which the three drugs are held constant are shown in Table 3. Shown are the single-drug effects of increasing concentrations of (A) AG490, (B) U0126, (C) indirubin-3'-monoxime and (D) GF 109203X on cellular ATP-level with respect to different levels of the other three drugs in the treatment. Here the second row fourth column subfigure corresponds to the cellular ATP-levels of A549 and AG02603 to varying concentrations of U0126 while the remaining three other drugs are held at the selected concentration in Table 3.
Figure 9
Figure 9
Two-drug interactions. The figure shows an evaluation of the model-predicted ATP-levels of A549 and AG02603 when the concentrations of two drugs are held constant while the concentration of the other two drugs are varied. The first and third columns (A) and (C) correspond to ATP levels of AG02603 in response to variations in different pairs of drug. The concentrations of the other two drugs are fixed at zero for column (A) and a selected combination (Table 3) for column (C). The second and fourth columns (B) and (D) correspond to ATP levels of A549 in response to variations in different pairs of drug (rows). The concentrations of the other two drugs are fixed at zero for column (B) and a selected combination (Table 3) for column (D). The figure shows that at the selected combination, the difference between the response surface of AG02603 and A549 is significantly higher than when the difference at zero concentrations.
Figure 10
Figure 10
Evaluation of the best combinations of all lower order mixtures of the drugs. (A) The performance of the best combination for single drugs as well as combinations of two, three, four drugs are shown. Also shown are the performances of the worst possible combinations. (B) The normalized ATP level for the best combination for all single, two, three, and four-drug mixtures are shown.
Figure 11
Figure 11
Analysis of models with varying numbers of regressors. Shown are the results of best subset regression algorithm which evaluates the best models of 1, 2, . . ., n regressors. (A) The residual sum of squares of the best models of A549 data as a function of the number of components (regressors). There is no significant decrease in the residual sum of squares for models with more than 10 regressors. (B) The residual sum of squares of the best models of AG02603 data as a function of the number of components (regressors). There is no significant decrease in the residual sum of squares for models with more than 7 regressors. (C) The regression coefficients for the best 10 component model of A549 data. The components involve single drug concentrations, pairwise and three-drug interactions. (D) The regression coefficients for the best 7 component model of AG02603 data. The components involve single drug concentrations and pairwise interactions.
Figure 12
Figure 12
System-level signaling interactions in A549 and AG02603 cells. Shown are some model-predicted system-level signaling interactions upon treatment with multiple drugs. The figure shows the interactions that are specific to A549, the interactions that are specific to AG02603, and the interactions common to both A549 and AG02603 cells. Direct arrows between the drugs and the ATP levels exist and are omitted to simplify the diagram.

References

    1. Janes KA, Albeck JG, Gaudet S, Sorger PK, Lauffenburger DA, Yaffe MB. A systems model of signaling identifies a molecular basis set for cytokine-induced apoptosis. Science. 2005;310(5754):1646–1653. doi: 10.1126/science.1116598. - DOI - PubMed
    1. Janes KA, Yaffe MB. Data-driven modelling of signal-transduction networks. Nat Rev Mol Cell Biol. 2006;7(11):820–828. doi: 10.1038/nrm2041. - DOI - PubMed
    1. Irish JM, Kotecha N, Nolan GP. Mapping normal and cancer cell signalling networks: towards single-cell proteomics. Nat Rev Cancer. 2006;6(2):146–155. doi: 10.1038/nrc1804. - DOI - PubMed
    1. Natarajan M, Lin KM, Hsueh RC, Sternweis PC, Ranganathan R. A global analysis of cross-talk in a mammalian cellular signalling network. Nat Cell Biol. 2006;8(6):571–580. doi: 10.1038/ncb1418. - DOI - PubMed
    1. Berenbaum M. Direct search methods in the optimisation of cancer chemotherapy regimens. Br J Cancer. 1990;61:101–109. doi: 10.1038/bjc.1990.22. - DOI - PMC - PubMed

Publication types