

A comparison of random forests, boosting and support vector machines for genomic selection
- PMID: 21624167
- PMCID: PMC3103196
- DOI: 10.1186/1753-6561-5-S3-S11
A comparison of random forests, boosting and support vector machines for genomic selection
Abstract
Background: Genomic selection (GS) involves estimating breeding values using molecular markers spanning the entire genome. Accurate prediction of genomic breeding values (GEBVs) presents a central challenge to contemporary plant and animal breeders. The existence of a wide array of marker-based approaches for predicting breeding values makes it essential to evaluate and compare their relative predictive performances to identify approaches able to accurately predict breeding values. We evaluated the predictive accuracy of random forests (RF), stochastic gradient boosting (boosting) and support vector machines (SVMs) for predicting genomic breeding values using dense SNP markers and explored the utility of RF for ranking the predictive importance of markers for pre-screening markers or discovering chromosomal locations of QTLs.
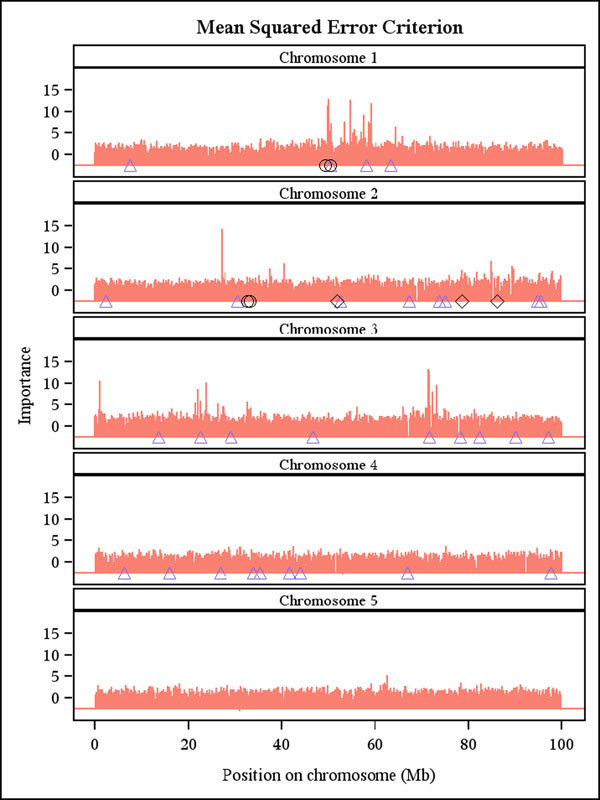
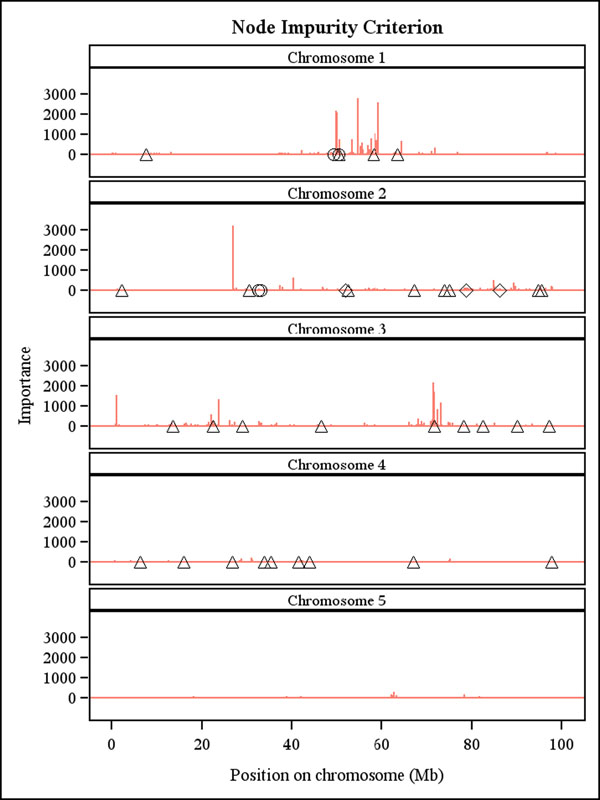
Methods: We predicted GEBVs for one quantitative trait in a dataset simulated for the QTLMAS 2010 workshop. Predictive accuracy was measured as the Pearson correlation between GEBVs and observed values using 5-fold cross-validation and between predicted and true breeding values. The importance of each marker was ranked using RF and plotted against the position of the marker and associated QTLs on one of five simulated chromosomes.
Results: The correlations between the predicted and true breeding values were 0.547 for boosting, 0.497 for SVMs, and 0.483 for RF, indicating better performance for boosting than for SVMs and RF.
Conclusions: Accuracy was highest for boosting, intermediate for SVMs and lowest for RF but differed little among the three methods and relative to ridge regression BLUP (RR-BLUP).
Figures
References
-
- Breiman L. Random forests. Machine Learning. 2001;45:5–32. doi: 10.1023/A:1010933404324. - DOI
-
- Liaw A, Wiener M. Classification and regression by randomForest. R News. 2002;2:18–22.
-
- Hastie TJ, Tibshirani R, Friedman J. The elements of statistical learning. Second. New York: Springer; 2009.
LinkOut - more resources
Full Text Sources
Other Literature Sources
