. 2011 Aug 15;255(1):18-31.
doi: 10.1016/j.taap.2011.05.012. Epub 2011 May 23.

Multi-walled carbon nanotube-induced gene expression in the mouse lung: association with lung pathology

Affiliations

Multi-walled carbon nanotube-induced gene expression in the mouse lung: association with lung pathology

M Pacurari et al. Toxicol Appl Pharmacol. .

Abstract

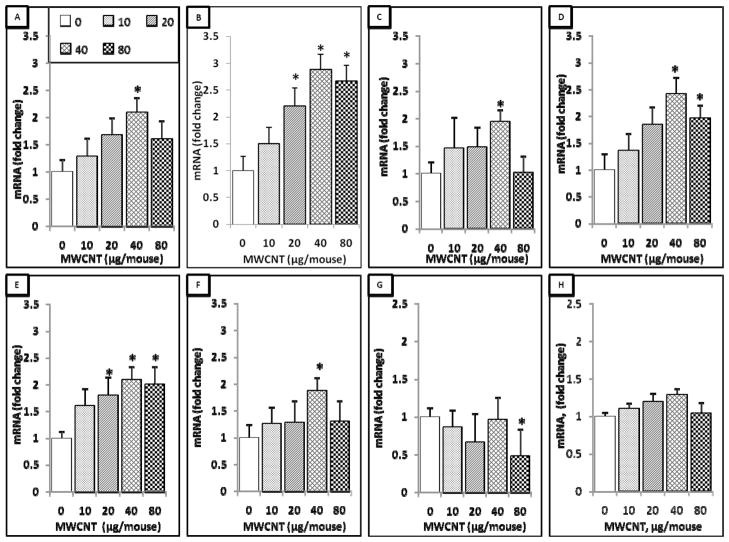
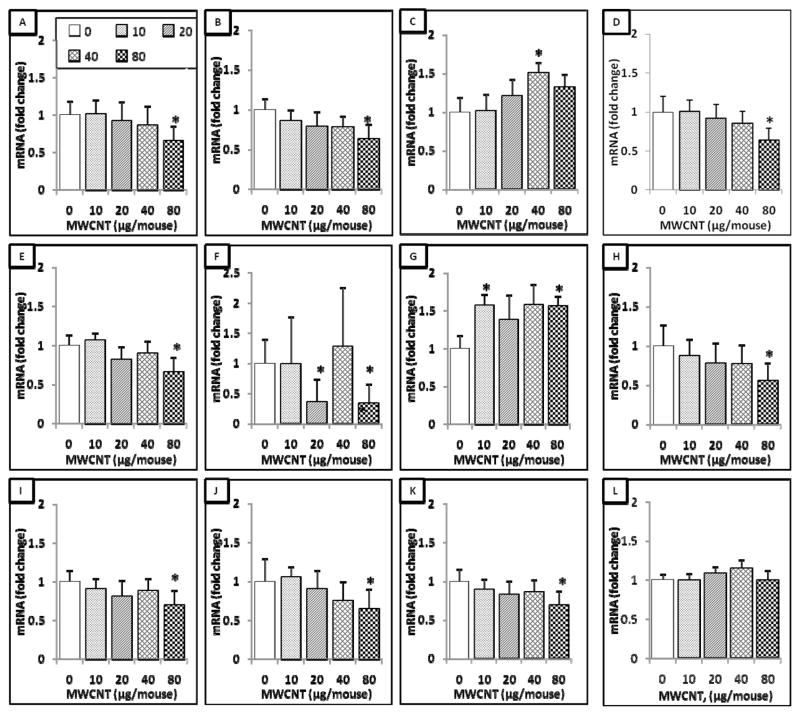
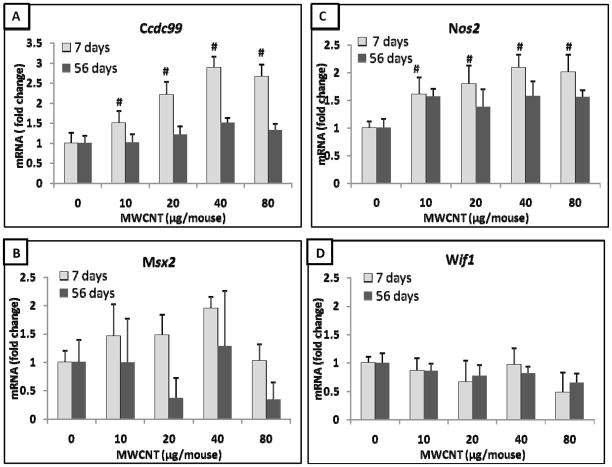
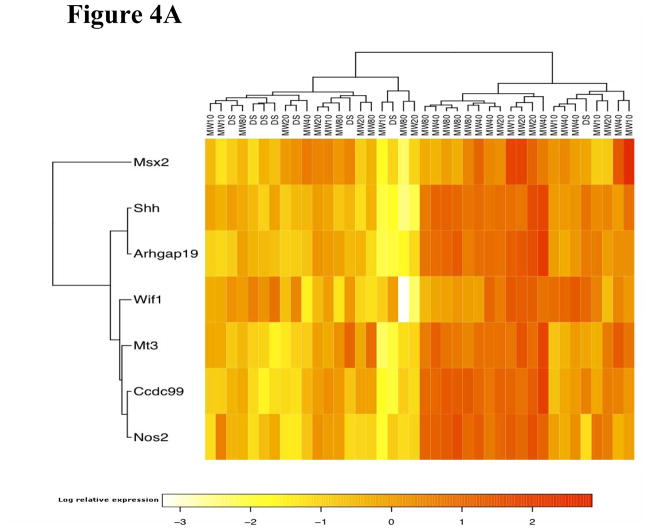
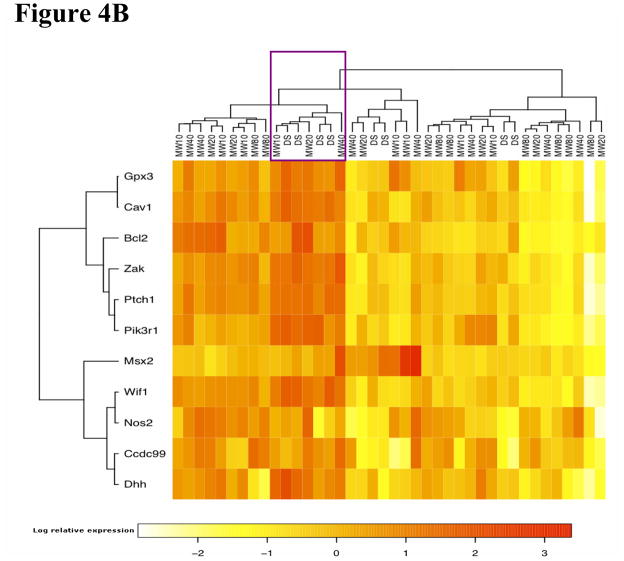
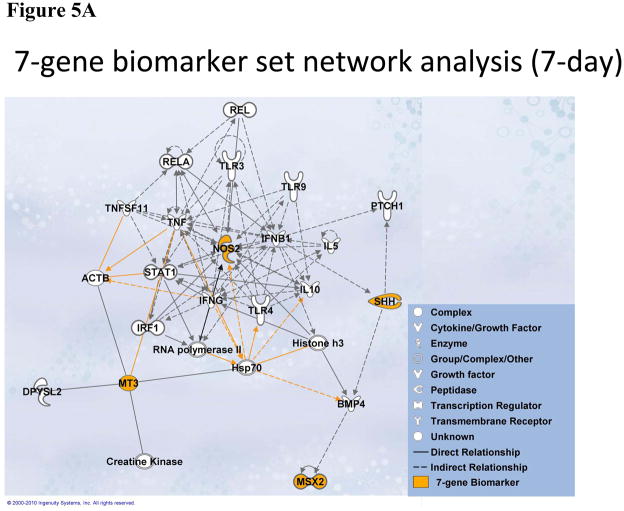
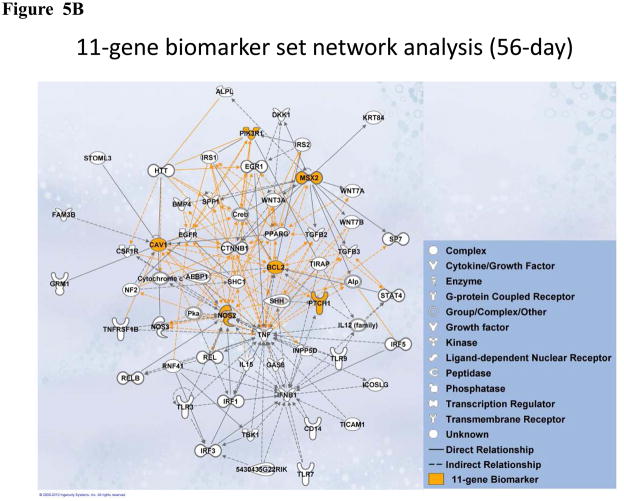
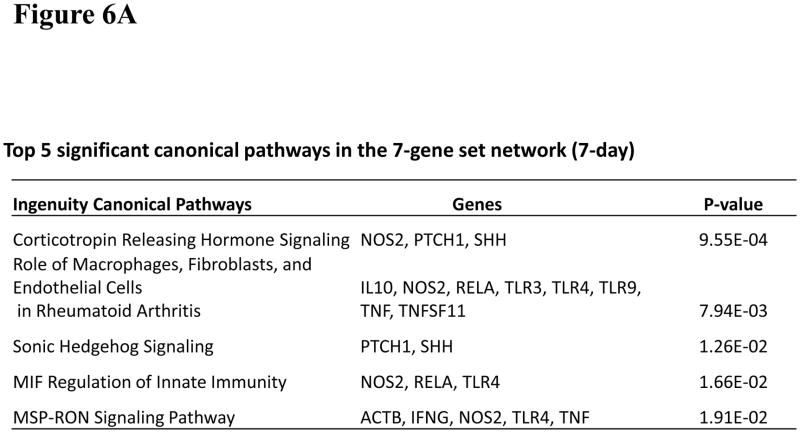
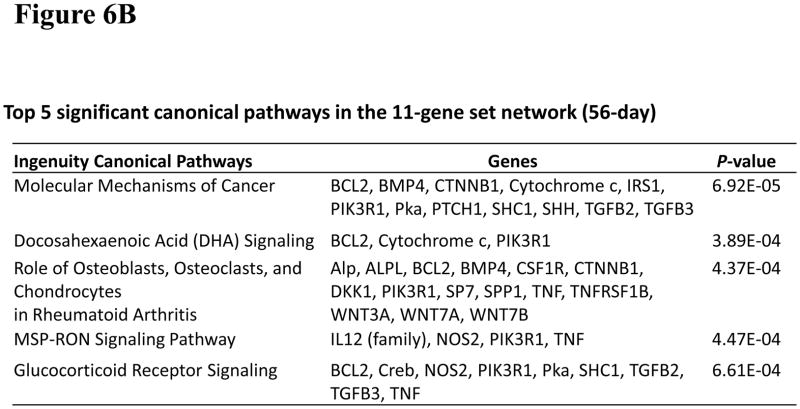
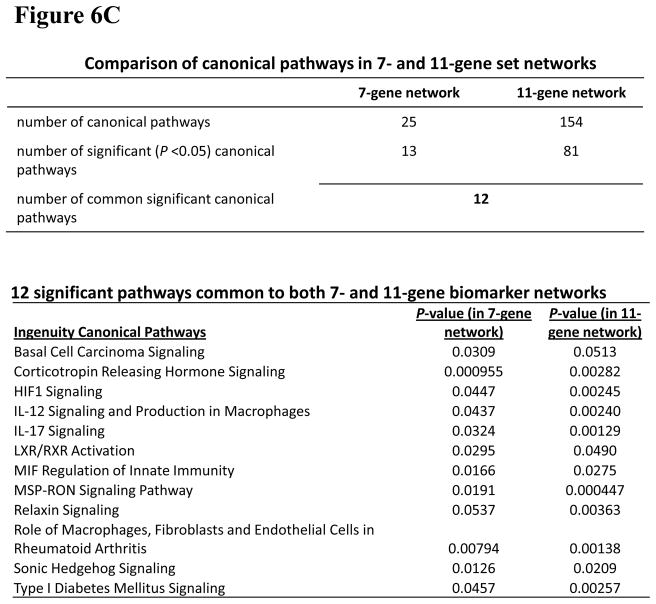
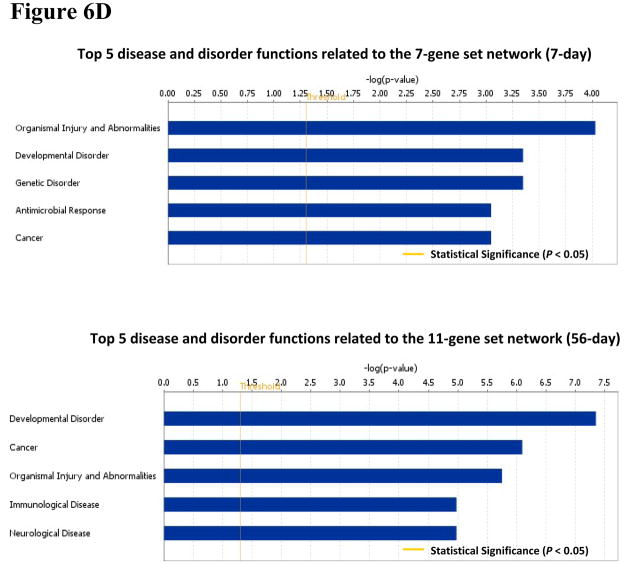
Due to the fibrous shape and durability of multi-walled carbon nanotubes (MWCNT), concerns regarding their potential for producing environmental and human health risks, including carcinogenesis, have been raised. This study sought to investigate how previously identified lung cancer prognostic biomarkers and the related cancer signaling pathways are affected in the mouse lung following pharyngeal aspiration of well-dispersed MWCNT. A total of 63 identified lung cancer prognostic biomarker genes and major signaling biomarker genes were analyzed in mouse lungs (n=80) exposed to 0, 10, 20, 40, or 80μg of MWCNT by pharyngeal aspiration at 7 and 56days post-exposure using quantitative PCR assays. At 7 and 56days post-exposure, a set of 7 genes and a set of 11 genes, respectively, showed differential expression in the lungs of mice exposed to MWCNT vs. the control group. Additionally, these significant genes could separate the control group from the treated group over the time series in a hierarchical gene clustering analysis. Furthermore, 4 genes from these two sets of significant genes, coiled-coil domain containing-99 (Ccdc99), muscle segment homeobox gene-2 (Msx2), nitric oxide synthase-2 (Nos2), and wingless-type inhibitory factor-1 (Wif1), showed significant mRNA expression perturbations at both time points. It was also found that the expression changes of these 4 overlapping genes at 7days post-exposure were attenuated at 56days post-exposure. Ingenuity Pathway Analysis (IPA) found that several carcinogenic-related signaling pathways and carcinogenesis itself were associated with both the 7 and 11 gene signatures. Taken together, this study identifies that MWCNT exposure affects a subset of lung cancer biomarkers in mouse lungs.


Figures

Figure 1
Figure 1
7-gene biomarker set in the mouse lung at 7 days post-exposure to MWCNT. Total RNA was extracted from the frozen lung tissue of mice that were exposed to different doses of MWCNT at 7 days post-exposure as indicated, followed by cDNA generation. Real-time PCR was performed to profile 63 lung cancer biomarker genes using LDA. Genes shown in the figure underwent significant changes in expression when compared to the negative control. A, Arhgap19. B, Ccdc99. C, Msx2. D, Mt3. E, Nos2. F, Shh. G, Wif1. H, 18S. Fold change was calculated after normalization to 18S and relative to control samples. Values given are mean ± SEM (p ≤ 0.05, n=8). * significantly different compared to control (unpaired t-tests).
Figure 2
Figure 2
11-gene biomarker set in the mouse lung at 56 days post-exposure to MWCNT. Total RNA was extracted from the frozen stored lung tissue of mice that were exposed to different doses of MWCNT at 56 days post-exposure as indicated, followed by cDNA generation. Real-time PCR was performed to profile 63 lung cancer biomarker genes using LDA. Genes shown in the figure underwent significant changes in expression when compared to the negative control. A, Bcl2. B, Cav1. C, Ccdc99. D, Dhh. E, Gpx3. F, Msx2. G, Nos2. H, Pi3kr1. I, Ptch1. J, Wif1. K, Zak. L, 18S. Fold change was calculated after normalization to 18S and relative to control samples. Values given are mean ± SEM (p ≤ 0.05, n=8). * significantly different compared to control (unpaired t-tests).
Figure 3
Figure 3
An overlapping 4-gene biomarker set in the mouse lung between 7- and 11-gene set at 7 and 56 days post-exposure to MWCNT, respectively. A, Ccdc99. B, Msx2. C, Nos2. D, Wif1. Fold change was calculated after normalization to 18S and relative to control samples. Values given are mean ± SEM (p ≤ 0.05, n=8). # significantly different compared to 56 days post-exposure.
Figure 4
Figure 4
Hierarchical clustering analysis. DS: control animal. The number after “MW” denotes the dosage used in the treatment. (A) Clustering analysis using the 7-gene biomarker set at 7 days post-exposure. (B) Clustering analysis using the 11-gene biomarker set at 56 days post-exposure. The marked cluster contains 4 control samples.
Figure 4
Figure 4
Hierarchical clustering analysis. DS: control animal. The number after “MW” denotes the dosage used in the treatment. (A) Clustering analysis using the 7-gene biomarker set at 7 days post-exposure. (B) Clustering analysis using the 11-gene biomarker set at 56 days post-exposure. The marked cluster contains 4 control samples.
Figure 5
Figure 5
Molecular network analysis using IPA. (A). Network associated with the 7-gene biomarker set identified from animals treated with MWCNT at 7 days post-exposure. (B). Network associated with the 11-gene biomarker set identified from animals treated with MWCNT at 56 days post-exposure.
Figure 5
Figure 5
Molecular network analysis using IPA. (A). Network associated with the 7-gene biomarker set identified from animals treated with MWCNT at 7 days post-exposure. (B). Network associated with the 11-gene biomarker set identified from animals treated with MWCNT at 56 days post-exposure.
Figure 6
Figure 6
Canonical pathways, diseases and functional disorders related to the networks generated from the 7- and 11-gene biomarker sets using IPA. (A). Canonical pathway analysis in the network related to the 7-gene biomarker set. (B). Canonical pathway analysis in the network related to the 11-gene biomarker set. (C). Comparison of canonical pathways in the 7- and 11-gene biomarker set network analysis. (D). Top 5 disease and disorder functions related to the 7-gene biomarker set network (at 7 day post-exposure) and the 11-gene biomarker set network (at 56 day post-exposure).
Figure 6
Figure 6
Canonical pathways, diseases and functional disorders related to the networks generated from the 7- and 11-gene biomarker sets using IPA. (A). Canonical pathway analysis in the network related to the 7-gene biomarker set. (B). Canonical pathway analysis in the network related to the 11-gene biomarker set. (C). Comparison of canonical pathways in the 7- and 11-gene biomarker set network analysis. (D). Top 5 disease and disorder functions related to the 7-gene biomarker set network (at 7 day post-exposure) and the 11-gene biomarker set network (at 56 day post-exposure).

References

    1. Afshari CA, Hamadeh HK, Bushel PR. The Evolution of Bioinformatics in Toxicology: Advancing Toxicogenomics. Toxicological Sciences. 2011;120:S225–S237. - PMC - PubMed
    1. Aubrecht J, Caba E. Gene expression profile analysis: an emerging approach to investigate mechanisms of genotoxicity. Pharmacogenomics. 2005;6:419–428. - PubMed
    1. Auerbach O, Garfinkel L, Parks VR. Scar cancer of the lung: increase over a 21 year period. Cancer. 1979;43:636–642. - PubMed
    1. Bushel PR, Heinloth AN, Li J, Huang L, Chou JW, Boorman GA, Malarkey DE, Houle CD, Ward SM, Wilson RE, Fannin RD, Russo MW, Watkins PB, Tennant RW, Paules RS. Blood gene expression signatures predict exposure levels. Proc Natl Acad Sci U S A. 2007;104:18211–18216. - PMC - PubMed
    1. Calvano SE, Xiao W, Richards DR, Felciano RM, Baker HV, Cho RJ, Chen RO, Brownstein BH, Cobb JP, Tschoeke SK, Miller-Graziano C, Moldawer LL, Mindrinos MN, Davis RW, Tompkins RG, Lowry SF. A network-based analysis of systemic inflammation in humans. Nature. 2005;437:1032–1037. - PubMed

Publication types