

. 2011 Jul;39(Web Server issue):W400-5.
doi: 10.1093/nar/gkr433.
Epub 2011 May 29.
GLAMM: Genome-Linked Application for Metabolic Maps
Affiliations
- PMID: 21624891
- PMCID: PMC3125797
- DOI: 10.1093/nar/gkr433
Item in Clipboard
GLAMM: Genome-Linked Application for Metabolic Maps
Nucleic Acids Res.
2011 Jul.
Abstract
The Genome-Linked Application for Metabolic Maps (GLAMM) is a unified web interface for visualizing metabolic networks, reconstructing metabolic networks from annotated genome data, visualizing experimental data in the context of metabolic networks and investigating the construction of novel, transgenic pathways. This simple, user-friendly interface is tightly integrated with the comparative genomics tools of MicrobesOnline [Dehal et al. (2010) Nucleic Acids Research, 38, D396-D400]. GLAMM is available for free to the scientific community at glamm.lbl.gov.
Figures
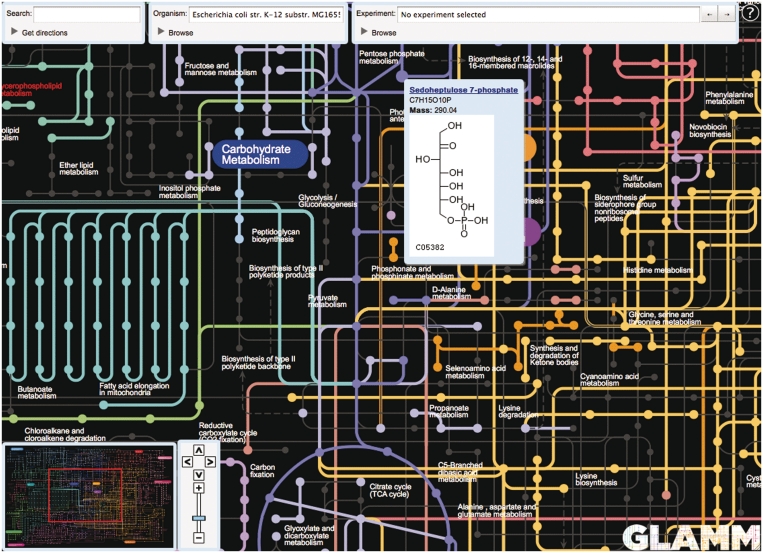
Metabolic reconstruction of E. coli K12 substr. MG1655 with metabolite information for Sedoheptulose 7-phosphate in a pop-up window. Reactions with genes identified in the reconstruction are shown in color, missing reactions in gray.
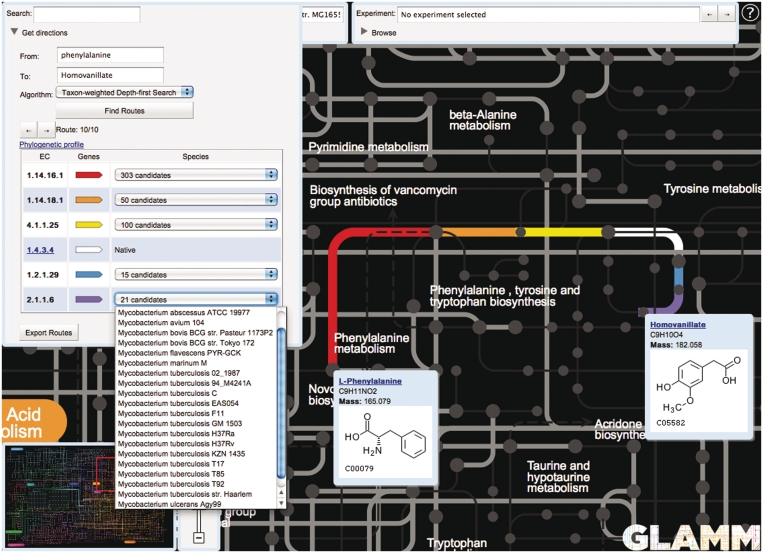
Route finding and retrosynthesis ‘Getting directions’ between the metabolites l -Phenylalanine and Homovanillate using E. coli K12 substr. MG1655 as the host organism. Both endogenous (white) and exogenous reactions (colored) are shown, including the species names for the source of candidate genes for the transgenic steps in the pathway.
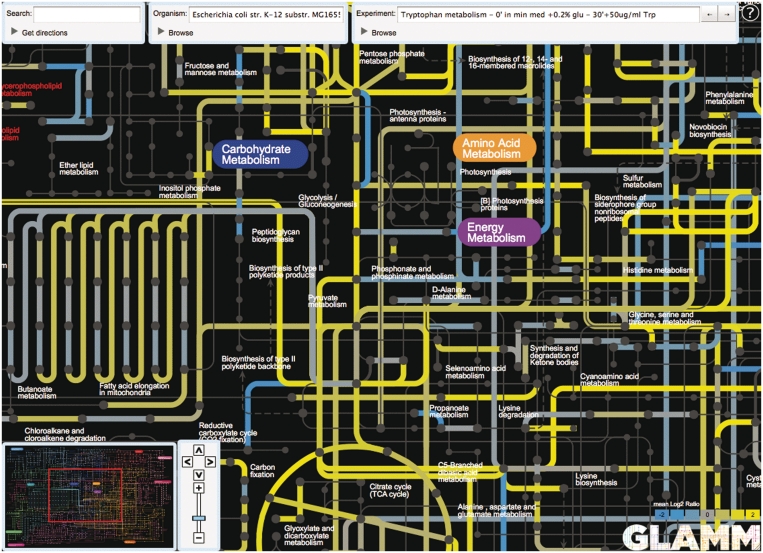
Experimental data visualization. Overlay of expression data collected during a metabolism experiment on E. coli K12 substr. MG1655. The reactions corresponding to upregulated genes are shown in yellow, reactions corresponding to downregulated genes are shown in blue.
References
-
- Letunic I, Yamada T, Kanehisa M, Bork P. iPath: interactive exploration of biochemical pathways and networks. Trends Biochem. Sci. 2008;33:101–103. - PubMed
Publication types
MeSH terms
LinkOut - more resources
Full Text Sources
Other Literature Sources
