. 2011 Sep 1;39(16):7263-75.
doi: 10.1093/nar/gkr278. Epub 2011 May 29.

EBP1 and DRBP76/NF90 binding proteins are included in the major histocompatibility complex class II RNA operon

Affiliations

EBP1 and DRBP76/NF90 binding proteins are included in the major histocompatibility complex class II RNA operon

Carmela Corso et al. Nucleic Acids Res. .

Abstract

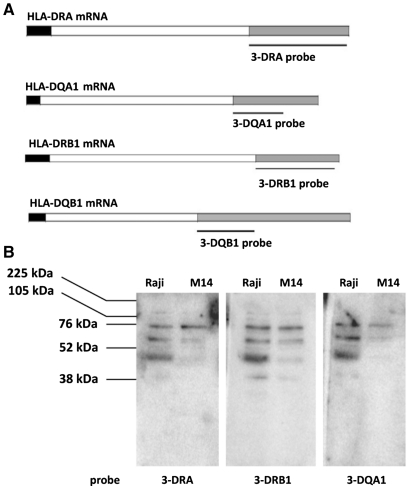
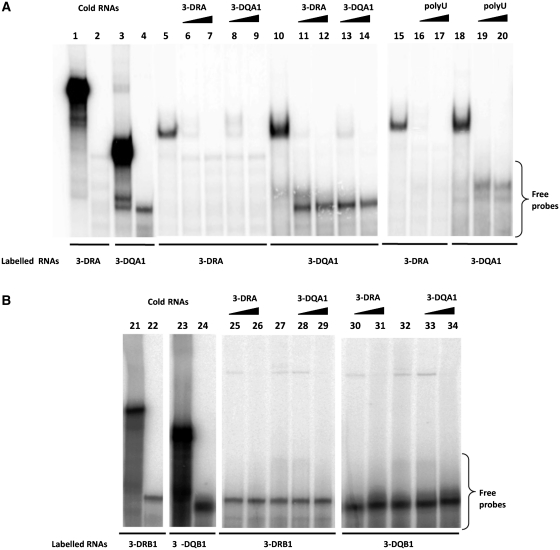
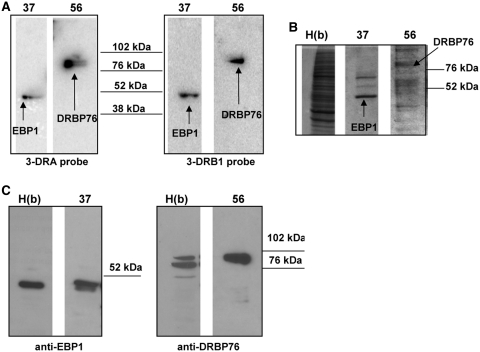
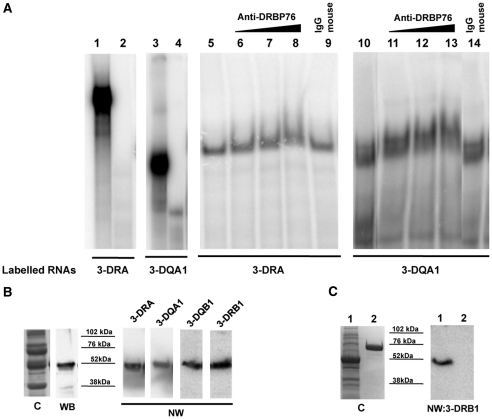
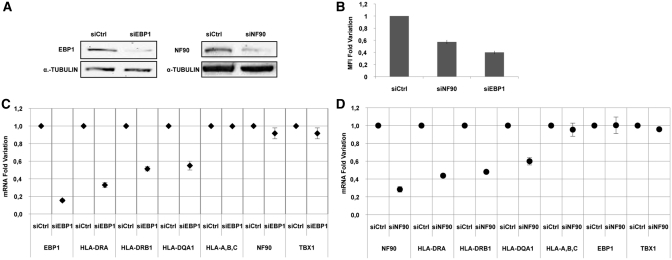
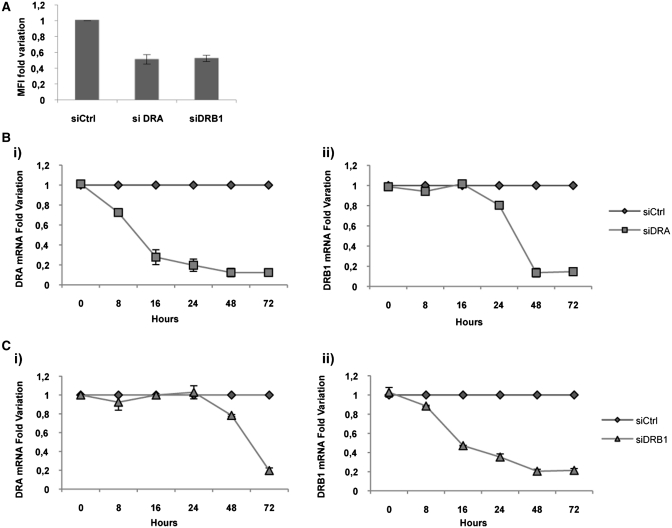
Major histocompatibility complex class II mRNAs encode heterodimeric proteins involved in the presentation of exogenous antigens during an immune response. Their 3'UTRs bind a protein complex in which we identified two factors: EBP1, an ErbB3 receptor-binding protein and DRBP76, a double-stranded RNA binding nuclear protein, also known as nuclear factor 90 (NF90). Both are well-characterized regulatory factors of several mRNA molecules processing. Using either EBP1 or DRBP76/NF90-specific knockdown experiments, we established that the two proteins play a role in regulating the expression of HLA-DRA, HLA-DRB1 and HLA-DQA1 mRNAs levels. Our study represents the first indication of the existence of a functional unit that includes different transcripts involved in the adaptive immune response. We propose that the concept of 'RNA operon' may be suitable for our system in which MHCII mRNAs are modulated via interaction of their 3'UTR with same proteins.


Figures

Figure 1.
Figure 1.
3′UTR of MHC II mRNAs-binding by northwestern. (A) Schematic representation of HLA-DRA, HLA-DRB1, HLA-DQA1 and HLA-DQB1 mRNAs with 5′UTR, coding region and 3′UTR indicated respectively as black, white and grey bars. The probes used are indicated. (B) Northwestern blot analysis of S100 extracts prepared from M14 and Raji cell lines carried out with 3-DRA, 3-DRB1 and 3-DQA1 riboprobes. The molecular weights are indicated.
Figure 2.
Figure 2.
3′UTR of MHC II mRNAs binding by REMSA. (A) REMSAs experiments performed using 3-DRA (lane 1) and 3-DQA1 (lane 3) riboprobes; lanes 2 and 4 show the digestion of riboprobes with T1 RNase. Lanes 5 and 15 show bands of interaction of M14 extract with 3-DRA, lanes 10 and 18 with 3-DQA1; competition experiments of 3-DRA binding were performed using cold 3-DRA (lanes 6 and 7), cold 3-DQA1 (lanes 8 and 9) and poly(U) homopolymers (lanes 16 and 17). Competition experiments of 3-DQA1 binding were performed using cold 3-DRA (lanes 11 and 12), cold 3-DQA1 (13 and 14) and poly(U) homopolymers (lanes 19 and 20). (B) REMSAs experiments carried out using 3-DRB1 (lane 21) and 3-DQB1 (lane 22) riboprobes. Lanes 22 and 24 show the digestion of riboprobes with T1 RNase; lanes 27 and 32 show bands of interaction of M14 extract with 3-DRB1 and 3-DQB1.Competition experiments of 3-DRB1 binding were performed using cold 3-DRA (lane 25 and 26) and cold 3-DQA1 (28 and 29). Competition experiments of 3-DQB1 binding were performed using cold 3-DRA (lanes 30 and 31) and cold 3-DQA1 (33 and 34).
Figure 3.
Figure 3.
Chromatograms of two-step purification of MHCII binding proteins. (A) Elution profile of the heparin-sepharose chromatography. The column was loaded with S100 Raji extract, washed and eluted with KCl discontinuous gradient. (B) Elution profile of the Mono Q chromatography. The column was loaded with the pooled fractions of peak b of the heparin-sepharose column, washed and eluted with a NaCl linear gradient. On the x-axis is indicated the fraction number, on the primary y-axis the absorbance at 280 nm, on the secondary y-axis the concentration of elution buffers, for both panels.
Figure 4.
Figure 4.
Identification of RNA binding proteins. (A) Northwestern blot analysis performed with 3-DRA probe and 3-DRB1 of Raji cell extracts after Mono Q chromatography. The lanes indicated with numbers 37 and 56 represent the fractions showing the binding; the identified proteins are indicated. The molecular weight markers are shown in the middle. (B) SDS–PAGE analysis of heparin-sepharose pool b, indicated as H(b) and of fractions 37 and 56. The gel was stained with coomassie blue. (C) western blot analysis with anti-EBP1 and anti-DRBP76 antibodies, after stripping the membranes analysed by northwestern blot.
Figure 5.
Figure 5.
Analysis of RNPs. (A) Supershift of complex with anti-DRBP76 in REMSA performed with 3-DRA (lane 1) and 3-DQA1 probes (lane 3). Lanes 2 and 4 show the digestion of riboprobes with T1 RNase. Lane 5 shows the interaction of M14 extract with 3-DRA probe while lanes 6–8 clearly show the gel mobility retardation of the complex, in binding reaction containing 0.5, 2 and 6 µg of anti-DRBP76 antibody. No supershift was found in the presence of 6 µg of control IgG (lane 9). In the same way, the binding of 3-DQA1 probe was performed in the absence of antibody (lane 10) or in the presence of 0.5, 2 and 6 µg of anti-DRBP76 antibody (lanes 11–13). No supershift was found in the presence of 6 µg of control IgG (lane 14). (B) Analysis of E. coli protein extract expressing recombinant EBP1. C represents the coomassie of SDS–PAGE, WB is the western blot performed with anti-EBP1, NW are the northwestern blot carried out with indicated riboprobes. (C) Analysis of E. coli protein extract expressing recombinant EBP1 (Lane 1). C represents the coomassie of SDS–PAGE, NW is the northwestern blot carried out with 3-DRB1 riboprobe. In lane 2 is loaded hnRNPH1 protein.
Figure 6.
Figure 6.
Modulation of MHCII expression following knockdown of EBP1 and DRBP76/NF90 proteins in M14 cells. (A) Western blot analysis of cell extracts after silencing of two proteins using siEBP1 and siNF90, performed with anti-EBP1, anti-DRBP76 and anti-α tubulin antibodies. (B) Flow cytometry analysis of cells transfected with siEBP1, siNF90 and siCtrl and stained with HLA-DR specific antibodies. Results are plotted as fold change of MFI (mean fluorescence intensity) value. (C) qRT–PCR analysis of total mRNAs after silencing with either siCtrl or siEBP1. The graph illustrates the mRNA fold variation of the transcripts indicated on the x-axis. (D) qRT–PCR analysis of total mRNAs following silencing with either siCtrl or siNF90. The graph illustrates the mRNA fold variation of the transcripts indicated on the x-axis. The standard deviations are shown in all graphs.
Figure 7.
Figure 7.
Downregulation of MHCII expression following knockdown of DRA or DRB1 mRNAs in M14 cells. (A) Flow cytometry analysis of the cell line transfected with and siCtrl, siDRA and siDRB1 and stained with HLA-DR-specific antibodies. Results are plotted as fold change of MFI (mean fluorescence intensity) value. (B) qRT–PCR analysis of total mRNAs following silencing with siDRA and siCtrl, analysed at different times after transfection. The B(i) panel shows HLA-DRA mRNA fold variation and the B(ii) shows HLA-DRB1 mRNA fold variation. (C) qRT–PCR analysis of total mRNAs following silencing with siDRB1 and siCtrl, analysed at different times after transfection. The C(i) panel shows HLA-DRA mRNA fold variation and C(ii) HLA-DRB1 mRNA fold variation. The standard deviations are shown in all graphs.

Similar articles

Cited by

References

    1. Cresswell P. Assembly, transport, and function of MHC class II molecules. Annu. Rev. Immunol. 1994;12:259–293. - PubMed
    1. Rodriguez T, Mendez R, Del Campo A, Aptsiauri N, Martin J, Orozco G, Pawelec G, Schadendorf D, Ruiz-Cabello F, Garrido F. Patterns of constitutive and IFN-gamma inducible expression of HLA class II molecules in human melanoma cell lines. Immunogenetics. 2007;59:123–133. - PubMed
    1. Guardiola J, Maffei A. Control of MHC class II gene expression in autoimmune, infectious, and neoplastic diseases. Crit. Rev. Immunol. 1993;13:247–268. - PubMed
    1. Reith W, LeibundGut-Landmann S, Waldburger JM. Regulation of MHC class II gene expression by the class II transactivator. Nat. Rev. Immunol. 2005;5:793–806. - PubMed
    1. Tite JP, Janeway CA., Jr Antigen-dependent selection of B lymphoma cells varying in Ia density by cloned antigen-specific L3T4a+ T cells: a possible in vitro model for B cell adaptive differentiation. J. Mol. Cell Immunol. 1984;1:253–265. - PubMed

Publication types

MeSH terms