. 2011 Jun 6;208(6):1203-14.
doi: 10.1084/jem.20102538. Epub 2011 May 30.

Hemophagocytosis causes a consumptive anemia of inflammation

Affiliations

Hemophagocytosis causes a consumptive anemia of inflammation

Erin E Zoller et al. J Exp Med. .

Abstract

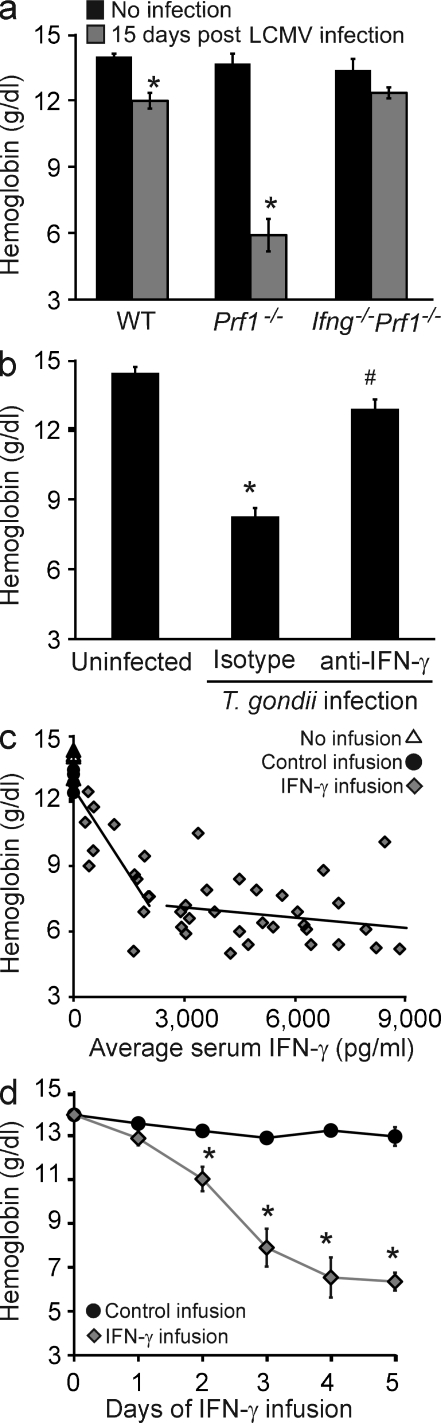
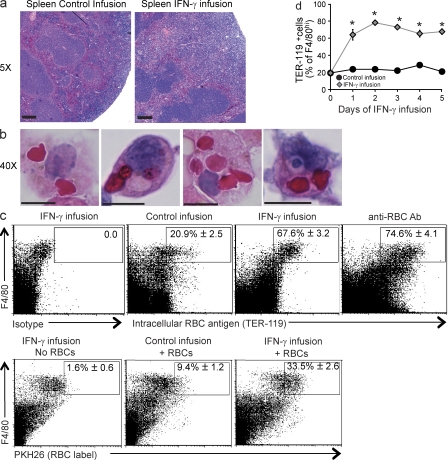
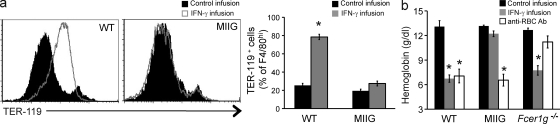
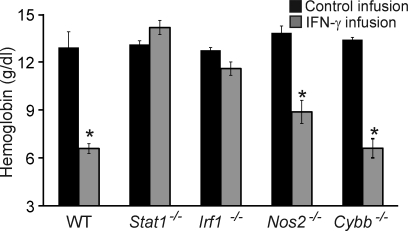
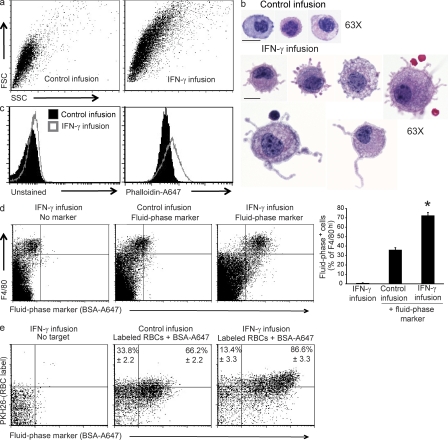
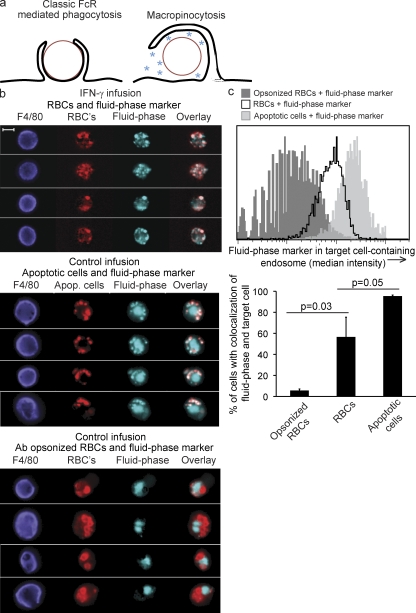
Cytopenias of uncertain etiology are commonly observed in patients during severe inflammation. Hemophagocytosis, the histological appearance of blood-eating macrophages, is seen in the disorder hemophagocytic lymphohistiocytosis and other inflammatory contexts. Although it is hypothesized that these phenomena are linked, the mechanisms facilitating acute inflammation-associated cytopenias are unknown. We report that interferon γ (IFN-γ) is a critical driver of the acute anemia observed during diverse microbial infections in mice. Furthermore, systemic exposure to physiologically relevant levels of IFN-γ is sufficient to cause acute cytopenias and hemophagocytosis. Demonstrating the significance of hemophagocytosis, we found that IFN-γ acts directly on macrophages in vivo to alter endocytosis and provoke blood cell uptake, leading to severe anemia. These findings define a unique pathological process of broad clinical and immunological significance, which we term the consumptive anemia of inflammation.


Figures

Figure 1.
Figure 1.
Sustained elevation of IFN-γ induces a severe consumptive anemia in physiological contexts and doses. (a) Blood hemoglobin concentrations were determined in WT, Prf1−/−, and Prf1−/−Ifng−/− mice before or 15 d after infection with LCMV. Data are mean values ± SEM. n = 5–9 mice per group combined from three experiments. *, P < 0.0001, compared with uninfected controls. (b) WT mice were left uninfected or were infected with T. gondii and, 4–5 d later, given either IFN-γ–neutralizing or isotype control antibody. 9 or 10 d after infection, hemoglobin concentrations were determined. Data are mean values ± SEM. n = 8–9 mice per group combined from two experiments. *, P < 0.0001, compared with all other points; #, P < 0.0001, compared with uninfected controls. (c) Mice were infused with various amounts of IFN-γ to achieve a range of serum levels of IFN-γ (x axis) for 5 d before blood hemoglobin concentrations were determined. The leftmost trend line includes control infusion mice (as 0 values). Each point represents an individual mouse. n = 53 mice. (d) WT mice were infused with saline or IFN-γ via osmotic pumps (to maintain levels >2,500 pg/ml in the IFN-γ group) and hemoglobin levels were assessed at the indicated times. Data are mean values ± SEM. n = 107 mice combined from five experiments. Zero time point represents mice that received no infusion. *, P ≤ 0.001, compared with control infusion.
Figure 2.
Figure 2.
Systemic IFN-γ exposure induces hemophagocytosis in vivo. (a and b) Brightfield micrographs of H&E-stained sections from mice infused with or without IFN-γ for 5 d of spleen sections (a; bars, 200 µm) or cytospun F4/80hi spleen cells (b; bars, 10 µm). (c, Top) mice were given 5-d IFN-γ infusions, 5-d control infusions, or injected with anti-RBC antibody 1 d before analyzing spleen cells. Spleen cells were permeabilized and stained intracellularly for RBC antigen (after blocking surface-exposed antigen with unlabeled antibody). (c, Bottom) Alternatively, RBCs were labeled with PKH26 and injected or not intravenously 24 h before spleen cell analysis. Dot plots are representative samples with mean percentages of n = 5–6 mice per group from two combined experiments (TER-119 staining) or n = 6–8 mice per group from three combined experiments (PKH26 labeling). Numbers represent the mean percentage TER+ or PKH+ of F4/80hi spleen cells ± SEM. (d) Mice were infused with IFN-γ for the indicated times and spleen cells were stained intracellularly (as in c) for RBC antigen. Data are mean values ± SEM. n = 6–11 mice per group combined from two experiments. *, P < 0.001 compared with control infusion.
Figure 3.
Figure 3.
IFN-γ acts directly on macrophages to induce hemophagocytosis and CAI. (a) WT and MIIG mice, which selectively lack IFN-γ signaling in macrophage-lineage cells, were given IFN-γ or control infusions for 5 d and intracellular RBC antigen was assessed in splenic F4/80hi macrophages by flow cytometry. Histograms are representative of three experiments and are gated onF4/80hi cells. Bar graph data are mean values ± SEM. n = 5–14 mice per group combined from three experiments. (b) WT, Fcer1g−/−, and MIIG mice were challenged with IFN-γ infusion (for 5 d) or anti-RBC antibody, and blood hemoglobin concentration was determined. Data are mean values ± SEM. n = 7–18 mice per group combined data from two or more experiments. *, P < 0.0001 compared with control infusion.
Figure 4.
Figure 4.
IFN-γ–driven CAI is STAT1 and IRF-1 dependent but largely NOS2 and Cybb independent. WT, Stat1−/−, and Irf1−/−, Nos2−/−, and Cybb−/− mice were infused with IFN-γ over 5 d and blood hemoglobin concentrations were determined. Data are mean values ± SEM. n = 3–13 per group combined from two or more experiments. *, P ≤ 0.001 compared with control infusion
Figure 5.
Figure 5.
IFN-γ infusion leads to increased size, membrane protrusions, F-actin assembly, and pinocytosis by macrophages. (a) 5 d after control or IFN-γ infusion, F4/80hi gated spleen cells were assessed by flow cytometry for forward/side scatter. Dot plots are representative of three experiments. (b) 3 d after control or IFN-γ infusion, mouse peritoneal cells were cytospun and stained for H&E. Bars, 10 µm. (c) 3 d after control or IFN-γ infusion, F-actin was measured in F4/80+ peritoneal cells by flow cytometric phalloidin-A647 staining. Histograms are representative of three experiments. (d) WT mice infused with IFN-γ for 1 d were injected with a fluid-phase marker (BSA-A647) and spleen cells were assessed 1 d later (while infusion continued) for uptake of this marker. Bar graph represents mean values ± SEM. n = 8–11 mice per group combined from three experiments. *, P < 0.001 compared with all conditions. (e) Mice infused with IFN-γ for 1 d were injected intravenously with PKH26-labeled RBCs along with BSA-A647 (as in d). 1 d later (while infusion continued), F4/80hi gated spleen cells were assessed for combined RBC and fluid-phase uptake by flow cytometry. Dot plots are representative two experiments. Numbers represent mean percentage of BSA+ of hemophagocytic (PKH+) F4/80hi spleen cells. n = 3–6 mice per group combined from two experiments.
Figure 6.
Figure 6.
IFN-γ–induced hemophagocytosis is a macropinocytic process. (a) Depictions of fluid-phase exclusion (classical ligand-driven phagocytosis) versus fluid-phase inclusion (macropinocytosis). PKH26-labeled apoptotic cells or RBCs (with or without opsonizing antibody), along with a fluid-phase marker (soluble Alexa Fluor 647), were injected i.p. into mice which had been infused for 48 h with saline or IFN-γ. 45 min after injection, peritoneal cavities were lavaged and F4/80hi cells were assessed for colocalization of fluid-phase marker and target cells. (b) Example images of peritoneal macrophages. Bar, 10 µm. (c) Histograms (gated on F4/80hi PKH+ A647+ cells) quantitating fluid-phase inclusion (median intensity) in target cell–containing endosomes (PKH minimum intensity mask, expanded 1 pixel), representative of three experiments. Bar graphs represent percentage of colocalization ± SD of the mean of fluid-phase and target cells, combining two experiments. *, P = 0.03, one-tailed Student’s t test.

References

    1. Abshire T.C. 1996. The anemia of inflammation. A common cause of childhood anemia. Pediatr. Clin. North Am. 43:623–637 10.1016/S0031-3955(05)70425-9 - DOI - PubMed
    1. Agarwal N., Prchal J.T. 2009. Anemia of chronic disease (anemia of inflammation). Acta Haematol. 122:103–108 10.1159/000243794 - DOI - PubMed
    1. Agarwal S., Narayan S., Sharma S., Kahkashan E., Patwari A.K. 2006. Hemophagocytic syndrome associated with visceral leishmaniasis. Indian J. Pediatr. 73:445–446 10.1007/BF02758574 - DOI - PubMed
    1. Alexander W.R., Richmond J., Roy L.M., Duthie J.J. 1956. Nature of anaemia in rheumatoid arthritis. II. Survival of transfused erythrocytes in patients with rheumatoid arthritis. Ann. Rheum. Dis. 15:12–20 10.1136/ard.15.1.12 - DOI - PMC - PubMed
    1. Amyere M., Mettlen M., Van Der Smissen P., Platek A., Payrastre B., Veithen A., Courtoy P.J. 2002. Origin, originality, functions, subversions and molecular signalling of macropinocytosis. Int. J. Med. Microbiol. 291:487–494 10.1078/1438-4221-00157 - DOI - PubMed

Publication types