. 2011 May 30;193(5):867-84.
doi: 10.1083/jcb.201010051.

PKCζ mediates disturbed flow-induced endothelial apoptosis via p53 SUMOylation

Affiliations

PKCζ mediates disturbed flow-induced endothelial apoptosis via p53 SUMOylation

Kyung-Sun Heo et al. J Cell Biol. .

Abstract

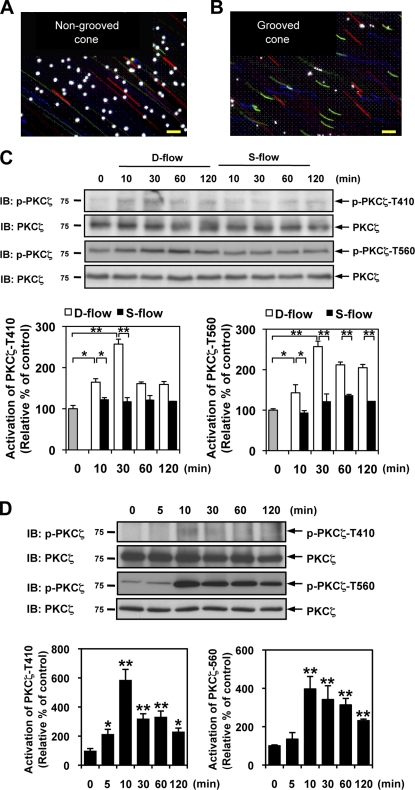
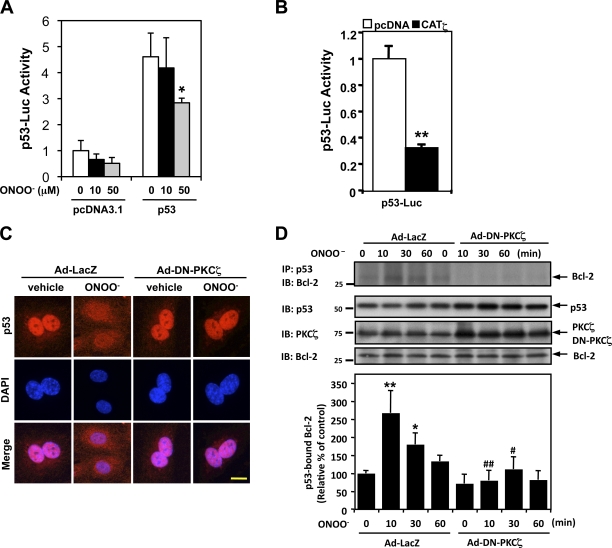
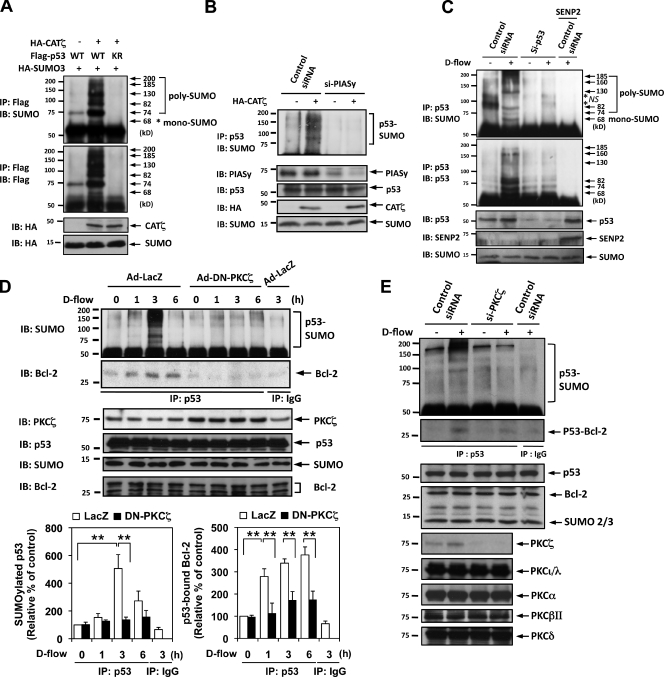
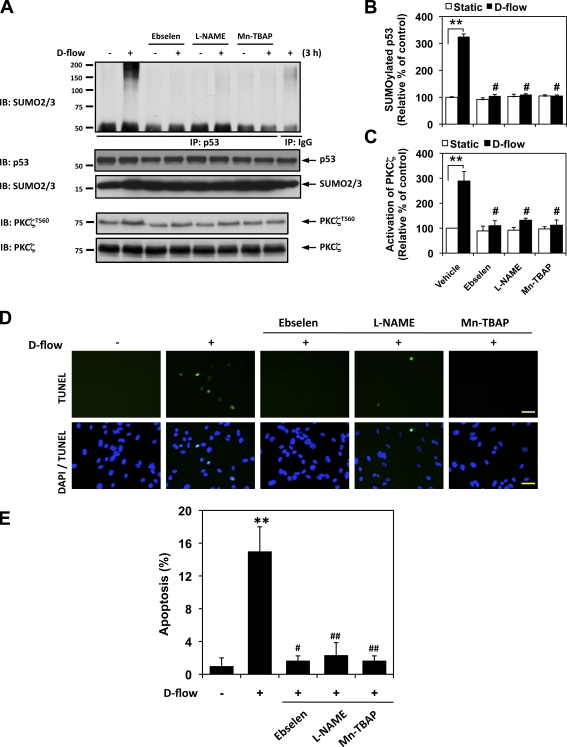
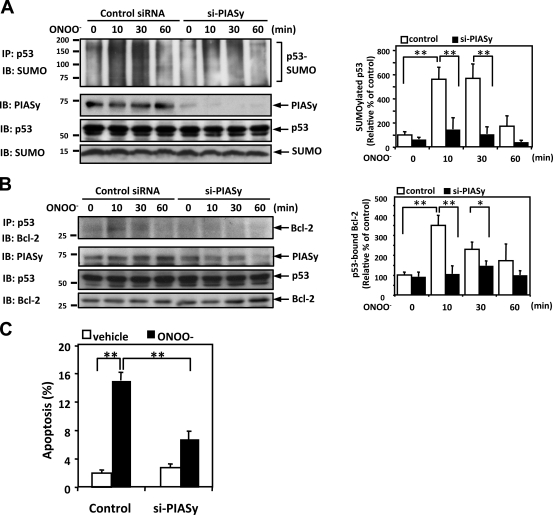
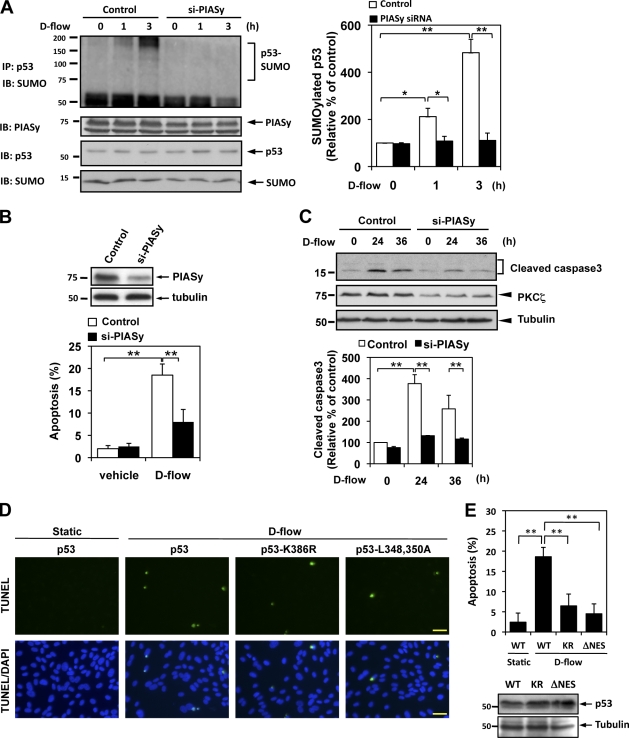
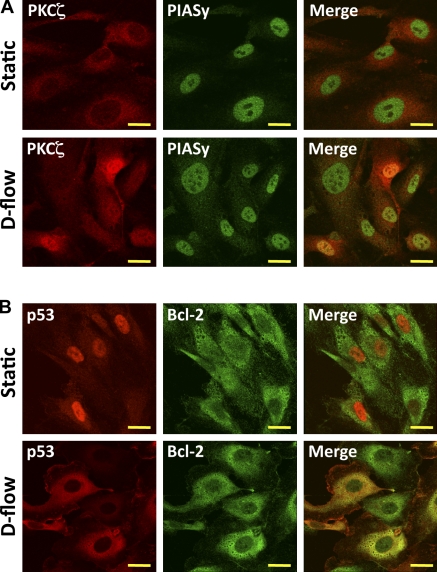
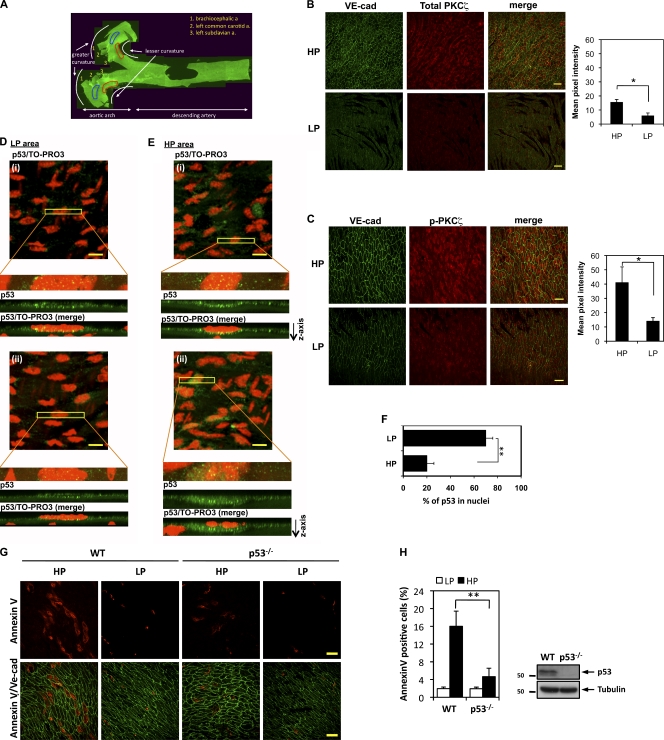
Atherosclerosis is readily observed in regions of blood vessels where disturbed blood flow (d-flow) is known to occur. A positive correlation between protein kinase C ζ (PKCζ) activation and d-flow has been reported, but the exact role of d-flow-mediated PKCζ activation in atherosclerosis remains unclear. We tested the hypothesis that PKCζ activation by d-flow induces endothelial cell (EC) apoptosis by regulating p53. We found that d-flow-mediated peroxynitrite (ONOO(-)) increased PKCζ activation, which subsequently induced p53 SUMOylation, p53-Bcl-2 binding, and EC apoptosis. Both d-flow and ONOO(-) increased the association of PKCζ with protein inhibitor of activated STATy (PIASy) via the Siz/PIAS-RING domain (amino acids 301-410) of PIASy, and overexpression of this domain of PIASy disrupted the PKCζ-PIASy interaction and PKCζ-mediated p53 SUMOylation. En face confocal microscopy revealed increases in nonnuclear p53 expression, nitrotyrosine staining, and apoptosis in aortic EC located in d-flow areas in wild-type mice, but these effects were significantly decreased in p53(-/-) mice. We propose a novel mechanism for p53 SUMOylation mediated by the PKCζ-PIASy interaction during d-flow-mediated EC apoptosis, which has potential relevance to early events of atherosclerosis.


Figures

Figure 1.
Figure 1.
PKCζ activation by d-flow and ONOO. (A and B) Generation of s-flow and d-flow using a cone and plate flow chamber. Tracks of fluorescent beads in a cone and plate flow chamber. S-flow was generated using a nongrooved cone (A), and d-flow was generated using a grooved cone (B). Note straight tracks with s-flow and short tracks with different orientations with d-flow, which are caused by beads going out of focus. Both cones were rotated at the same speed. Color tracks indicate time x (red), time x + 10 s (green), and time x + 20 s (blue). Bright dots are beads adhered to the dish. Exposure time is 0.4 s. Bars, 100 µm. (C and D) HUVECs were stimulated by s- or d-flow (C) or ONOO (D) for the indicated times, and PKCζ phosphorylation was determined by Western blotting. The level of PKCζ phosphorylation was determined by taking the ratio of optical densities between antiphospho-PKCζ and anti-PKCζ bands (bar graphs) as described in Materials and methods. The experiments were performed in triplicate using three different batches of s- or d-flow or ONOO-stimulated HUVECs (means ± SD; n = 3; *, P < 0.05; and **, P < 0.01 compared with control). Molecular masses are given in kilodaltons. IB, immunoblot.
Figure 2.
Figure 2.
PKCζ depletion by siRNA and DN-PKCζ inhibits d-flow and ONOO-induced apoptosis. (A) HUVECs were transfected with control or PKCζ siRNA for 48 h and then stimulated with d-flow for 36 h followed by TUNEL staining. Images were recorded as described in Materials and methods after counterstaining with DAPI to visualize nuclei (bottom). Apoptotic nuclei appear green (top). Bars, 25 µm. (right) Quantification of apoptosis is shown as the percentage of TUNEL-positive cells. (B) HUVECs were transfected with control or PKCζ siRNA for 48 h (left) or transduced with Ad-DN-PKCζ or Ad-LacZ as a control for 24 h (center). Cells were then treated with 100 µM ONOO or vehicle for 8 h and assayed by TUNEL staining. (right) DN-PKCζ and reduced PKCζ expression were confirmed by Western blotting with anti-PKCζ. Data are from three separate experiments using two or more different EC preparations (**, P < 0.01). (C) After transduction of Ad-DN-PKCζ or Ad-LacZ for 24 h, HUVECs were treated with 100 µM ONOO for 9 and 18 h, and Western blotting with anti–cleaved caspase 3 was performed. DN-PKCζ expression and protein loading were assessed by Western blotting with anti-PKCζ (middle) and antitubulin (bottom). (right) Quantification of cleaved caspase 3 is expressed as the relative ratio compared with tubulin expression. Results are expressed as the relative percentage of untreated cells in the LacZ control (100%). n = 3. **, P < 0.01 compared with each control. Molecular masses are given in kilodaltons. Error bars are means ± SD.
Figure 3.
Figure 3.
PKCζ mediates ONOO-induced p53 nuclear export and p53–Bcl-2 binding instead of the regulation of p53 transcriptional activity. (A and B) HUVECs were transfected with the p53-Luc reporter and Renilla luciferase–encoding plasmid (pRL- thymidine kinase) used as an internal control reporter together with p53–wild type or vector alone (pcDNA3.1; A). Some cells were further transfected with or without pcDNA3.1-CATζ (B). Transcriptional activity was determined by a reporter plasmid encoding 13 copies of the p53-binding sequence (p53-Luc reporter; Kern et al., 1992). After 24 h of transfection, p53 transcriptional activity was assayed using the dual-luciferase kit (B), or the cells were further treated with 10 or 50 µM ONOO for 8 h as indicated, and luciferase activity was assayed (A). Data are representative of triplicates using two or more different preparations of ECs. *, P < 0.05; **, P < 0.01. (C) HUVECs were transduced with Ad-DN-PKCζ or Ad-LacZ as a control for 24 h, treated with vehicle or 100 µM ONOO for 4 h, and immunostained with anti-p53 followed by DAPI counter staining for nuclei. Bar, 5 µm. (D, top) HUVECs were transduced with Ad-DN-PKCζ or Ad-LacZ for 24 h and stimulated with 100 µM ONOO for the indicated times. p53–Bcl-2 binding was determined by coimmunoprecipitation with anti-p53 followed by immunoblotting with anti–Bcl-2. p53, PKCζ, and Bcl-2 in total cell lysates were detected by Western blotting with each specific antibody. (bottom) Quantification of p53–Bcl-2 binding expressed as the relative band intensity ratio between coimmunoprecipitated versus total Bcl-2. Results were normalized as described in Fig. 1. n = 3. *, P < 0.05 and **, P < 0.01 compared with the vehicle control, and #, P < 0.05 and ##, P < 0.01 compared with the LacZ control at each time point. Molecular masses are given in kilodaltons. Error bars indicate means ± SD. IB, immunoblot. IP, immunoprecipitation.
Figure 4.
Figure 4.
PKCζ mediates d-flow–induced p53 SUMOylation and p53–Bcl-2 binding. (A) HeLa cells were transfected for 24 h as indicated with Flag-tagged p53, HA-tagged SUMO3, and HA-tagged CATζ. p53 SUMOylation was detected by immunoprecipitation with anti-Flag followed by Western blotting with anti-SUMO2/3 (top). Both protein expression and immunoprecipitated p53 were confirmed by anti-Flag antibody, and CATζ and SUMO expression were detected with anti-HA. Mono-SUMOylation band (∼74 kD) and poly-SUMOylation bands (>78 kD) were detected. The asterisk indicates mono-SUMOylation of p52. (B) HUVECs were transfected for 24 h with either PIASy or control siRNA as indicated, and then the cells were transfected with HA-CATζ or vector alone for another 24 h. (top) p53 SUMOylation was detected by immunoprecipitation with anti-p53 followed by Western blotting with anti-SUMO2/3. PIASy expression was confirmed by immunoblotting with anti-PIASy, and p53, HA-CATζ, and SUMO expression was confirmed with anti-p53, -HA, and -SUMO2/3, respectively. (C) HUVECs were transfected with either p53 or control siRNA as indicated for 24 h, and then the cells were transduced with an Ad-SENP2 or LacZ with a control for another 24 h. p53 SUMOylation, expression of p53, SENP2, and SUMO were determined as described in Materials and methods. The asterisks indicate nonspecific bands. (D) HUVECs were transduced with Ad-DN-PKCζ or Ad-LacZ as a control for 24 h and then stimulated with d-flow for the indicated times. p53 SUMOylation and p53–Bcl-2 binding were determined as described in Materials and methods. (left graph) Intensities of SUMOylated p53 bands at 74, 82, 130, and 185 kD were quantified by densitometry after subtracting background gel density. After normalization of each control as described in Fig. 1, results were expressed relative to the SUMOylation level in static condition (0 min; 100%). Shown are means ± SD (n = 3). **, P < 0.01 compared with the vehicle control or the LacZ control at each time point. (E) HUVECs were transfected with either PKCζ or control siRNA as indicated for 24 h and then stimulated with d-flow for 3 h. p53 SUMOylation, p53–Bcl-2 binding, expression of p53, Bcl-2, SUMO, and various PKC isoforms as indicated were determined as described in Materials and methods. Immunoblots are representative of three separate experiments. Molecular masses are given in kilodaltons. IB, immunoblot. IP, immunoprecipitation. KR, K386R. WT, wild type.
Figure 5.
Figure 5.
ONOO mediates d-flow–induced PKCζ activation, p53 SUMOylation, and EC apoptosis. (A) ONOO mediates d-flow–induced PKCζ activation and p53 SUMOylation. HUVECs were pretreated by 5 µM ebselen, 20 µM L-NAME, and 10 µM Mn-TBAP for 30 min and exposed to d-flow for 3 h. PKCζ phosphorylation at Thr560 and p53 SUMOylation were determined as described in Materials and methods. (B and C) Densitometry analyses of p53 SUMOylation (B) and PKCζ phosphorylation (C) were performed as described in Fig. 1. **, P < 0.01 compared with the vehicle control in static condition, and #, P < 0.01 compared with the vehicle control in d-flow stimulation for 3 h. (D and E) HUVECs were pretreated by each inhibitor for 30 min and exposed to d-flow for 36 h followed by TUNEL staining as described in Materials and methods (D), and quantification of apoptosis is shown as the percentage of TUNEL-positive cells (E). Bars, 30 µm. Data are from three separate experiments using two or more different EC preparations (**, P < 0.01 compared with the vehicle control in static condition, and #, P<0.05 and ##, P<0.01 compared with the vehicle control in d-flow stimulation for 36 h). Error bars show means ± SD. Molecular masses are given in kilodaltons. IB, immunoblot. IP, immunoprecipitation.
Figure 6.
Figure 6.
ONOO induces p53 SUMOylation and p53–Bcl-2 binding via PIASy activation. (A and B) HUVECs were transfected with PIASy siRNA (si-PIASy) or control siRNA for 48 h and then stimulated with 100 µM ONOO for the indicated times. p53 SUMOylation (A) and p53–Bcl-2 binding (B) were determined as described in Materials and methods. (left) PIASy and p53 expressions were detected by Western blotting with appropriate specific antibodies. Densitometric analyses of p53 SUMOylation (A) and p53–Bcl-2 binding (B) were performed as described in Fig. 1. (C) HUVECs were transfected with PIASy or control siRNA for 48 h. After treatment with 100 µM ONOO for 8 h, apoptotic nuclei were detected by TUNEL staining. Data are expressed as mean percentages ± SD from three independent experiments. *, P < 0.05; **, P < 0.01. Molecular masses are given in kilodaltons. IB, immunoblot. IP, immunoprecipitation.
Figure 7.
Figure 7.
D-flow induces p53 SUMOylation and apoptosis via PIASy activation. (A) HUVECs were transfected with PIASy siRNA (si-PIASy) or control siRNA for 48 h and then stimulated with d-flow for the indicated times. p53 SUMOylation, expression of PIASy, p53, and SUMO2/3 were detected as described in Material and methods. Densitometric analyses of p53 SUMOylation were performed as described in Fig. 1. (B and C) HUVECs were transfected with PIASy or control siRNA for 48 h. After treatment with d-flow for 36 h, apoptotic nuclei were detected by TUNEL staining (B, bottom), and Western blotting with anti–cleaved caspase 3 (C, top) was performed. Immunoblots of PIASy conformed depletion of PIASy by the specific siRNA (B, top). Densitometry analysis of cleaved caspase 3 expression was performed as described in Fig. 2 C (bottom). The experiments were performed in triplicate using three different batches of d-flow–stimulated HUVECs. (D) HUVECs were transduced with an adenovirus vector containing p53, p53-K386R (KR; sumoylation defect mutant), or p53-ΔNES (L348,350A; NES mutant) for 24 h and then stimulated with d-flow for 36 h followed by TUNEL staining as described in Materials and methods. (E, top) Quantification of apoptosis shown as the percentage of TUNEL-positive cells. Bars, 30 µm. (bottom) Equal expressions of p53, p53-K386R, and p53-ΔNES were analyzed by Western blotting in ECs. Data are from three separate experiments using two or more different EC preparations. Error bars show means ± SD; *, P < 0.05; **, P < 0.01. Molecular masses are given in kilodaltons. IB, immunoblot. IP, immunoprecipitation. WT, wild type.
Figure 8.
Figure 8.
PKCζ–PIASy association is critical for p53 SUMOylation and p53–Bcl-2 binding. (A) HUVECs were stimulated with 100 µM ONOO for the indicated times and subjected to immunoprecipitation with anti-PIASy followed by Western blotting with anti-PKCζ (top). (B and C) Association between PKCζ and PIASy was tested by a mammalian two-hybrid assay. HeLa cells were transfected with plasmids containing Gal4-PKCζ wild type and VP16-PIASy (B) or truncated mutants of VP16-PIASy (C) as well as the Gal4-responsive luciferase reporter pG5-luc. After 24 h of transfection, cells were stimulated with 100 µM ONOO or vehicle for 16 h, and luciferase activity was quantified. Luciferase activity was normalized with the Renilla luciferase (Luc.) activity (Woo et al., 2008). Data are representative of three experiments using two or more different preparations of ECs (means ± SD; **, P < 0.01). (D) PIASy binding to PKCζ occurs via a domain consisting of aa 301–410 of PIASy. HeLa cells were transfected with each of the Flag-tagged PIASy fragments, and then pull-down assays were preformed using anti-Flag and IgG Sepharose beads in the presence of GST-fused recombinant PKCζ. Association of PIASy fragments with GST-PKCζ was assayed by Western blotting with anti-PKCζ. (bottom) PIASy fragment expression was detected by Western blotting with anti-Flag. (E) PIASy Fr3, but not Fr4, inhibited PKCζ–PIASy association. HUVECs were cotransfected with HA-tagged PKCζ wild type, Myc-tagged PIASy wild type, and Flag-tagged PIASy Fr3 or Fr4 for 24 h. Myc-PIASy wild type was immunoprecipitated with anti-Myc followed by immunoblotting with anti-HA (top). The expression of PKCζ, PIASy, and PIASy fragments was detected by Western blotting with specific antibodies. Data are representative of three independent experiments. (F) HUVECs were transfected with Flag-tagged PIASy Fr3 or Fr4 or control vectors for 24 h and then stimulated by d-flow for 3 h. p53 was immunoprecipitated using anti-p53, and d-flow–induced p53 SUMOylation was analyzed by immunoblotting with anti-SUMO2/3 (top). The expression of p53, SUMO, and PIASy fragments was detected by Western blotting with specific antibodies. Data are representative of three independent experiments. Molecular masses are given in kilodaltons. IB, immunoblot. IP, immunoprecipitation. WT, wild type.
Figure 9.
Figure 9.
D-flow–induced PKCζ–PIASy association in nuclei and p53–Bcl-2 binding in the cytosol. (A and B) HUVECs were stimulated with either static or d-flow for 3 h and immunoassayed with antibodies of mouse anti-PKCζ and rabbit anti-PIASy (A) or mouse anti-p53 and rabbit anti–Bcl-2 (B). After d-flow stimulation, yellow in the merged images represent colocalization between PKCζ and PIASy in nuclei or p53 and Bcl-2 in cytosol. Images were recorded using a confocal microscope equipped with a Plapon 60× 1.42 NA oil lens objective. Shown are representative images from cells analyzed from three independent experiments in which ≥30 cells were analyzed per experiment. Bars, 10 µm.
Figure 10.
Figure 10.
Increases in phosphorylated and total PKCζ and nonnuclear p53 expression within the d-flow regions (HP areas) and decreased apoptosis in ECs of p53−/− mice. (A) A representative epifluorescence image of the whole specimen. Fixed aortas of wild-type mice were cut longitudinally, and the arch region was further cut into two halves. Areas of d-flow (HP area; lesser curvature) are outlined in red, and neighboring areas of s-flow (LP area) are lined in blue. a, artery. (B and C) En face preparations were double stained with anti–VE-cadherin (VE-cad; used as an EC marker) and an anti–total PKCζ antibody (B) or phospho-PKCζ T560 antibody (C). X-y axis images were collected at 0.5-µm increments so that a z stack of ∼4-µm thickness from the luminal surface was obtained. From each image background, fluorescence intensity was subtracted, and the pixel number of the stained region per unit area of the endothelium in HP and LP area within the aortic arch was determined (n = 3). Areas of d-flow (HP areas; lesser curvature) show both increased total and phospho-PKCζ expression compared with the neighboring areas of s-flow (LP area). Bars, 20 µm. Bar graphs show quantification of total (B) and phospho (C)-PKCζ in HP and LP areas. Data are shown as means ± SEM; *, P < 0.05. (D and E) Increased cytoplasmic p53 localization in HP area ECs. Aortic arches were immunostained for endothelial p53 (green). Nuclei were stained using TO-PRO3 (red). From initial stacked x-y axis images (top), a narrow rectangular area crossing an EC was selected for x-y-z scanning at 0.1-µm increments. Images below the clipped images show rectangular z-axis images. Two representative sets of images (i and ii) are shown for LP (D) and HP (E) areas. Bars, 10 µm. (F) Quantification of nuclear p53. The pixel number of nuclear and nonnuclear regions per cell was determined, and the ratio of nuclear/total intensity was calculated from 60 cells from each HP and LP area (four cells/field, five fields/mouse, and a total of three mice). (G) The number of d-flow–mediated annexin V–positive cells (red) in the HP area is decreased in the mice deficient for p53 (p53 knockout) compared with the wild-type mouse aorta. Anti–VE-cadherin staining (green) was used as a marker for ECs. Bars, 100 µm. (H, left) Quantification of apoptotic cells. Percentages of annexin V–positive cells in LP and HP areas determined from 7-wk wild-type and p53-deficient mice (n = 3 each) are shown. In HP area, the number of annexin V–positive cells are significantly decreased in the p53 knockout compared with the wild type. **, P < 0.01. (right) Deletion of p53 was confirmed by Western blotting with anti-p53 using a lung protein lysate. Molecular masses are given in kilodaltons. Data are shown as means ± SEM. WT, wild type.

Comment in

References

    1. Akaike M., Che W., Marmarosh N.L., Ohta S., Osawa M., Ding B., Berk B.C., Yan C., Abe J.. 2004. The hinge-helix 1 region of peroxisome proliferator-activated receptor gamma1 (PPARgamma1) mediates interaction with extracellular signal-regulated kinase 5 and PPARgamma1 transcriptional activation: involvement in flow-induced PPARgamma activation in endothelial cells. Mol. Cell. Biol. 24:8691–8704. 10.1128/MCB.24.19.8691-8704.2004 - DOI - PMC - PubMed
    1. Alvarez M.N., Piacenza L., Irigoín F., Peluffo G., Radi R.. 2004. Macrophage-derived peroxynitrite diffusion and toxicity to Trypanosoma cruzi. Arch. Biochem. Biophys. 432:222–232. 10.1016/j.abb.2004.09.015 - DOI - PubMed
    1. Bischof O., Schwamborn K., Martin N., Werner A., Sustmann C., Grosschedl R., Dejean A.. 2006. The E3 SUMO ligase PIASy is a regulator of cellular senescence and apoptosis. Mol. Cell. 22:783–794. 10.1016/j.molcel.2006.05.016 - DOI - PubMed
    1. Boggon T.J., Eck M.J.. 2004. Structure and regulation of Src family kinases. Oncogene. 23:7918–7927. 10.1038/sj.onc.1208081 - DOI - PubMed
    1. Carter S., Bischof O., Dejean A., Vousden K.H.. 2007. C-terminal modifications regulate MDM2 dissociation and nuclear export of p53. Nat. Cell Biol. 9:428–435. 10.1038/ncb1562 - DOI - PubMed

Publication types