. 2011 Jun 15;124(Pt 12):1965-72.
doi: 10.1242/jcs.076570.

Redistribution of caveolae during mitosis

Affiliations

Redistribution of caveolae during mitosis

Emmanuel Boucrot et al. J Cell Sci. .

Abstract

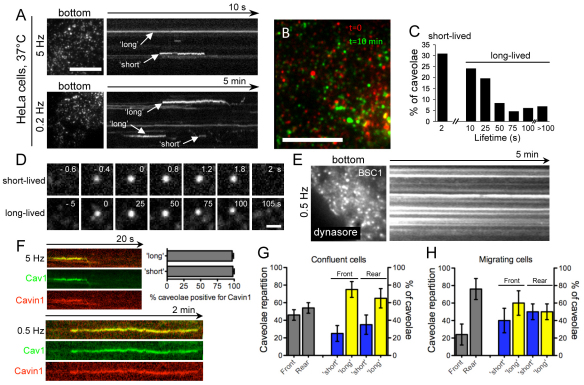
Caveolae form a specialized platform within the plasma membrane that is crucial for an array of important biological functions, ranging from signaling to endocytosis. Using total internal reflection fluorescence (TIRF) and 3D fast spinning-disk confocal imaging to follow caveola dynamics for extended periods, and electron microscopy to obtain high resolution snapshots, we found that the vast majority of caveolae are dynamic with lifetimes ranging from a few seconds to several minutes. Use of these methods revealed a change in the dynamics and localization of caveolae during mitosis. During interphase, the equilibrium between the arrival and departure of caveolae from the cell surface maintains the steady-state distribution of caveolin-1 (Cav1) at the plasma membrane. During mitosis, increased dynamics coupled to an imbalance between the arrival and departure of caveolae from the cell surface induces a redistribution of Cav1 from the plasma membrane to intracellular compartments. These changes are reversed during cytokinesis. The observed redistribution of Cav1 was reproduced by treatment of interphase cells with nocodazole, suggesting that microtubule rearrangements during mitosis can mediate caveolin relocalization. This study provides new insights into the dynamics of caveolae and highlights precise regulation of caveola budding and recycling during mitosis.


Figures

Fig. 1.
Fig. 1.
Slow captures reveal long-lived caveolae during interphase. (A) TIRF micrographs of a HeLa cell stably expressing Cav1–EGFP and maintained at 37°C. The still images (labeled ‘bottom’) correspond to bottom optical section acquired at the beginning of data collection and the kymographs show a projection across time of the complete time series. A representative fast capture (5 Hz, at 200-msecond intervals, for 10 seconds) is displayed in the top panel and a representative slow one (0.2 Hz, at 5-second intervals for 5 minutes) in the lower panel. Note the presence of dynamic caveolae in both fast and slow captures. Scale bar: 10 μm. (B) Representative still TIRF images acquired at a 10 minute interval at the plasma membrane of a cell stably expressing Cav1–EGFP. To emphasize the dynamics of most of the caveolae, the first image ‘t=0’ was colored red and the last ‘t=10 min’ green. Note that very few objects were present in both time points (they appear yellow). The full time series is visible in supplementary material Movie 1. Scale bar: 10 μm. (C) Histogram showing distribution of the lifetimes of Cav1–EGFP spots at the plasma membrane calculated from time-series acquired during interphase. The data derive from three cells (n=133). (D) TIRF time-lapse acquisition of a typical short-lived caveola (acquired at 5 Hz) and of a typical long-lived one (acquired at 0.2 Hz). Scale bar: 5 μm. (E) BSC1 cells stably expressing Cav1–EGFP were incubated for 30 minutes with 80 μM dynasore, a cell-permeable small molecule inhibitor of dynamin GTPase function (Macia et al., 2006), before transfer to the TIRF microscope. A time series was collected by TIRF at 0.5 Hz (500 ms interval) for 5 minutes at 37°C. The still image (bottom) corresponds to the lower optical section acquired at the beginning of data collection; the kymograph (right) represents the complete time-series. The data are representative of experiments done in triplicate. Note the numerous frozen Cav1–EGFP structures at the plasma membrane. (F) Kymograph showing that short- and long-lived caveolae (imaged at 5 and 0.5 Hz, respectively) contained both Cav1–EGFP and cavin1–RFP. The histogram shows that virtually all Cav1–EGFP-positive caveolae were positive for cavin1–RFP (n=50). (G) Histogram showing repartition of caveolae on the front or rear of confluent cells (left, gray bars; n=200). Note that as BSC-1 cells are poorly polarized when confluent, the rear side was determined as the half surface area of the cell containing the nucleus. Repartition of short-lived (≤2 seconds, blue bars) and long-lived (>2 seconds, yellow bars) caveolae at the front or rear of confluent cells is shown on the right (n=200). (H) Histogram showing repartition of caveolae on the front or rear of migrating cells (left, gray bars; n=200). Cell migration was induced by wounding a confluent monolayer (see Materials and Methods). Cells migrating within the wound 12–16 hours after were imaged. Repartition of short-lived (≤2 seconds, blue bars) and long-lived (>2 seconds, yellow bars) caveolae on the front or rear of confluent cells is shown on the right (n=200). Results are mean ± s.e.m.
Fig. 2.
Fig. 2.
TIRF analysis of caveolae dynamics along the cell cycle. (A) Representative still TIRF images acquired every 10 minutes at the plasma membrane of BSC1 cells stably expressing Cav1–EGFP. The cells were in interphase, rounding-up phase (pro-metaphase), metaphase and membrane recovery phase during daughter cell formation (anaphase–cytokinesis), as illustrated by confocal images on the first column. DNA was stained using the membrane-permeant dye Hoechst 33342. Note also that only one of the two daughter cells was followed in this capture. To emphasize the dynamics of most of the Cav1–EGFP structures during all stages of the cell cycle, the first image ‘0’ was colored in red and the last 10 minutes (2 minutes for metaphase) in green in the overlay panel. To facilitate comparisons, we used here for interphase the same capture than in Fig. 1B. The full time-series of the interphase and cytokinesis cell are visible in supplementary material Movies 1 and 2, respectively. Scale bar: 10 μm. (B) Surface density of Cav1–EGFP-containing structures at the plasma membrane during interphase (I), pro-metaphase (P), metaphase (M) and cytokinesis (C). The data (mean ± s.e.m.) were obtained from still images taken every 10 minutes from three time-series for each category. (C) Percentages of arrivals (blue) versus departures (pink) of Cav1–EGFP caveolae during interphase (I), pro-metaphase (P) and cytokinesis (C). The data (mean ± s.e.m.) were obtained from six time-series for each category. Note the equilibrium between the arrivals and departures during interphase, but the clear unbalances toward departures or arrivals during pro-metaphase and cytokinesis, respectively. **P<0.001. (D) The histogram distribution compares lifetimes of Cav1–EGFP spots at the plasma membrane calculated from time-series acquired during interphase (black), pro-metaphase (gray) or cytokinesis (white). The data derive from three cells in interphase (n=133, same data set as used in Fig. 2), four cells in pro-metaphase (n=146) and five cells in cytokinesis (n=210).
Fig. 3.
Fig. 3.
Cav1 redistributes from the plasma membrane to intracellular compartments during metaphase and returns during cytokinesis. (A) Orthogonal fluorescent views corresponding to the distribution of Cav1–EGFP in a live BSC1 cell stably expressing this construct and imaged by spinning-disk confocal microscopy at 37°C. Top panels show the fluorescence signal along the z-axis corresponding to sequential optical sections acquired 0.25 μm apart. Middle panels show a single confocal plane positioned within the cell as indicated by the yellow dotted line on the top panels. Insets are focusing on the plasma membrane; arrowheads point to plasma membrane Cav1–EGFP. Scale bar: 10 μm. (B) Quantification of Cav1 signals at the plasma membrane (PM) in BSC1 cells stably expressing Cav1–EGFP or in BSC1, A431 and HeLa cells immunolabeled for the endogenous Cav1 (pictures shown in supplementary material Fig. S2G) during interphase (I), metaphase (M) and cytokinesis (C). The PM signals were quantified in every plane of the Z-stacks and normalized to interphase values (mean ± s.e.m.). Total levels of Cav1–EGFP did not vary during metaphase (black bars, right). At least six cells from three independent experiments were analyzed for each category. **P<0.001; ns, non-significant. (C) Cavin-1–RFP colocalizes with internalized Cav1–EGFP during metaphase. During interphase and cytokinesis cavin-1 colocalizes only with surface Cav1. (D) Internalization of CTBgold by metaphase A431 cells. CTBgold was internalized for 20 minutes at 37°C. The cell surface was then labeled with CTBHRP at 4°C. CTBgold that has been internalized is observed within CTBHRP-negative structures (arrowheads); surface CTBgold is associated with CTBHRP-positive structures. Note that CTBgold is frequently observed in internal structures and rarely in surface caveolae. c, chromosomes; N, nucleus. Scale bars: 5 μm (main panel) and 100 nm (inset). (E) Immunoelectron microscopy of Cav1 in metaphase A431 cells. CTBgold (14 nm) was internalized for 20 minutes before fixation. Cav1 was specifically labelled using an N-terminally directed antibody that does not recognise the Golgi pool of caveolin (anti-VIPN) (Dupree et al., 1993) and detected with gold-coupled antibody (6 nm). Note the tubular elements labeled for Cav1 (small gold) containing CTBgold (large gold, arrowheads). (F) Quantification of surface and internalized caveolae in interphase and metaphase cells. CTBgold internalization using the dual labeling assay, expressed as the ratio of CTBgold within CTBHRP-negative (internal) compartments as a percentage of caveolar and internal gold. Results (n=24 cells) show mean ± s.e.m. **P<0.001. (G) Caveola budding rate determined by electron microscopy. Cells were incubated with CTBHRP for 1 minute at 37°C, and treated with ascorbic acid to quench the surface CTBHRP peroxidase activity, as described previously (Kirkham et al., 2005; Le Lay et al., 2006). Surface (CTBHRP negative) and internalized caveolae (CTBHRP labeled) are then quantified. The data (mean ± s.e.m.) express the number of caveolae that budded (CTBHRP positive) in a minute as percentage of total plasma membrane caveolae and were obtained from eight cells in interphase and four in metaphase.
Fig. 4.
Fig. 4.
Microtubule depolymerization induces relocalization of surface caveolae to early endosomes. (A) BSC1 cells stably expressing Cav1–EGFP and transiently expressing EEA1-mRFP were incubated at 37°C with normal medium (control) or with 10 μM nocodazole (a microtubule depolymerizing drug) for 1 hour (Nocodazole, 1 hour), or with 10 μm noccodazole for 1 hour followed by 1 hour in normal medium (Washout). A representative middle confocal plane is presented. Arrowheads indicate plasma membrane Cav1, arrows show internalized Cav1–EGFP colocalizing with EEA1–mRFP. Scale bar: 10 μm. (B) Percentage of cells having Cav1 at the plasma membrane before (0) and after 0.5, 1 or 2 hours incubation with 10 μM nocodazole (Nocodazole, dark grey bars), followed by 1 or 2 hours incubation back to normal medium (Washout, light grey bars).The data (mean ± s.e.m.) were obtained from at least 100 cells (from three independent experiments) at each time point. (C) Green bars show quantification of Cav1 signals at the plasma membrane in BSC1 cells stably expressing Cav1–EGFP (left), or fixed and stained for endogenous Cav1 (right) and treated as in A for 1 hour at 37°C with control (C), 10 μM nocodazole (N) or 10 μM nocodazole for 1 hour followed by a 1 hour washout with normal medium (W). The plasma membrane signals were quantified in each plane of Z-stacks and normalized to interphase values (mean ± s.e.m.). Red bars show percentage of EEA1-positive early endosomes colocalizing with Cav1–EGFP in cells treated the same way. Ten cells from three independent experiments were analyzed for each category. **P<0.001. (D) Percentages of arrivals (blue) versus departures (pink) of Cav1–EGFP caveolae in cells treated as in A for 1 hour at 37°C with control (C), 10 μM nocodazole (N). The data (mean ± s.e.m.) were obtained from two time-series for each category. **P<0.001.

References

    1. Bergeland T., Widerberg J., Bakke O., Nordeng T. W. (2001). Mitotic partitioning of endosomes and lysosomes. Curr. Biol. 11, 644-651 - PubMed
    1. Boucrot E., Kirchhausen T. (2007). Endosomal recycling controls plasma membrane area during mitosis. Proc. Natl. Acad. Sci. USA 104, 7939-7944 - PMC - PubMed
    1. Cerezo A., Guadamillas M. C., Goetz J. G., Sanchez-Perales S., Klein E., Assoian R. K., Del Pozo M. A. (2009). Absence of Caveolin-1 increases proliferation and Anchorage-independent growth by a Rac-dependent, Erk-independent mechanism. Mol. Cell. Biol. 29, 5046-5059 - PMC - PubMed
    1. Doherty G. J., McMahon H. T. (2009). Mechanisms of endocytosis. Annu. Rev. Biochem. 78, 857-902 - PubMed
    1. Dupree P., Parton R. G., Raposo G., Kurzchalia T. V., Simons K. (1993). Caveolae and sorting in the trans-Golgi network of epithelial cells. EMBO J. 12, 1597-1605 - PMC - PubMed

Publication types