Comparative Study
. 2011;6(5):e19400.
doi: 10.1371/journal.pone.0019400. Epub 2011 May 20.

Unexpected course of nonlinear cardiac interbeat interval dynamics during childhood and adolescence

Affiliations
Comparative Study

Unexpected course of nonlinear cardiac interbeat interval dynamics during childhood and adolescence

Dirk Cysarz et al. PLoS One. 2011.

Abstract

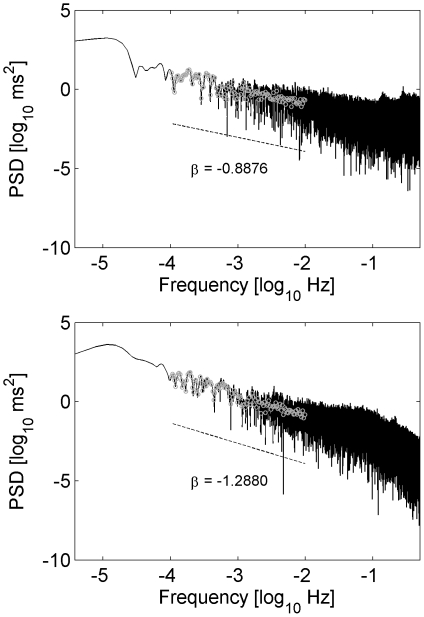
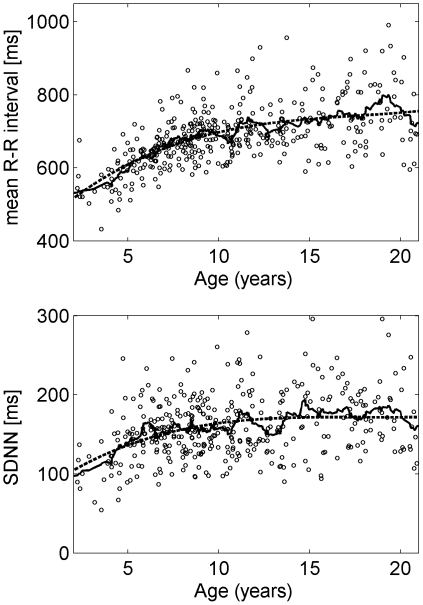
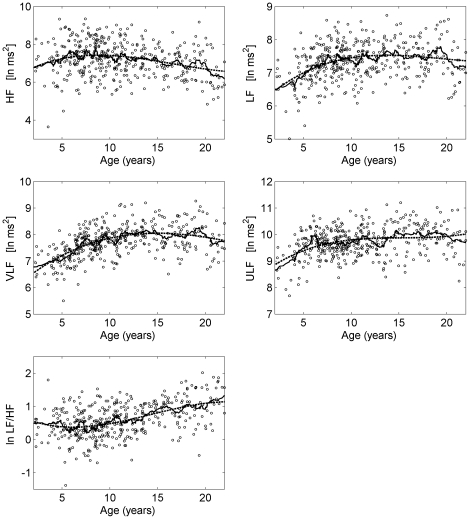
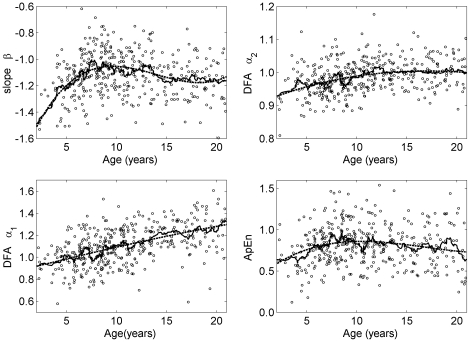
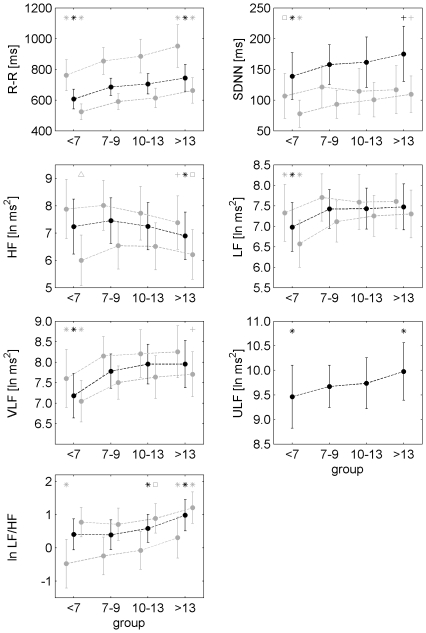
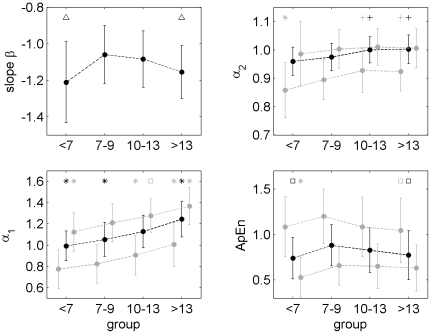
The fluctuations of the cardiac interbeat series contain rich information because they reflect variations of other functions on different time scales (e.g., respiration or blood pressure control). Nonlinear measures such as complexity and fractal scaling properties derived from 24 h heart rate dynamics of healthy subjects vary from childhood to old age. In this study, the age-related variations during childhood and adolescence were addressed. In particular, the cardiac interbeat interval series was quantified with respect to complexity and fractal scaling properties. The R-R interval series of 409 healthy children and adolescents (age range: 1 to 22 years, 220 females) was analyzed with respect to complexity (Approximate Entropy, ApEn) and fractal scaling properties on three time scales: long-term (slope β of the power spectrum, log power vs. log frequency, in the frequency range 10(-4) to 10(-2) Hz) intermediate-term (DFA, detrended fluctuation analysis, α(2)) and short-term (DFA α(1)). Unexpectedly, during age 7 to 13 years β and ApEn were higher compared to the age <7 years and age >13 years (β: -1.06 vs. -1.21; ApEn: 0.88 vs. 0.74). Hence, the heart rate dynamics were closer to a 1/f power law and most complex between 7 and 13 years. However, DFA α(1) and α(2) increased with progressing age similar to measures reflecting linear properties. In conclusion, the course of long-term fractal scaling properties and complexity of heart rate dynamics during childhood and adolescence indicates that these measures reflect complex changes possibly linked to hormonal changes during pre-puberty and puberty.


Conflict of interest statement

Competing Interests: The authors have declared that no competing interests exist.

Figures

Figure 1
Figure 1. Examples of the power spectral density (PSD) of a 24 h R-R interval series in a double logarithmic plot (decadic logarithm as indicated by ‘log10’).
The slope β denotes the slope of the linear regression calculated using the averaged PSD (grey circles; frequency range: 10−4 to 10−2 Hz). Top: male subject, age 7.9 years; bottom: male subject, age 18.1 years.
Figure 2
Figure 2. Course of the mean R-R interval and its accompanying standard deviation (SDNN) as basic time domain measures during childhood and adolescence.
The circles represent 24 h averages. Solid and dashed lines show moving average and the fitted polynomial model of order 3, respectively.
Figure 3
Figure 3. Course of the frequency domain measures during childhood and adolescence.
HF – high frequency component, LF – low frequency component, VLF – very low frequency component, ULF – ultra low frequency component, ln ms2 – natural logarithm of the absolute values in ms2, ln LF/HF - natural logarithm of the ratio LF/HF. The circles represent 24 h averages. Solid and dashed lines show moving average and the fitted polynomial model of order 3, respectively.
Figure 4
Figure 4. Course of the fractal and complexity measures during childhood and adolescence.
Slope β – long-term fractal scaling properties, DFA α2 – intermediate-term fractal scaling properties, DFA α1 – short-term fractal scaling properties, ApEn - complexity. The dots represent 24 hour averages. Solid and dashed lines show moving average and the fitted polynomial model of order 3, respectively.
Figure 5
Figure 5. Comparison of different age groups with respect to time and frequency domain measures.
R-R – mean R-R interval, SDNN – standard deviation of R-R interval series, HF – high frequency component, LF – low frequency component, VLF – very low frequency component, ULF – ultra low frequency component, ln ms2 – natural logarithm of the absolute values in ms2, ln LF/HF - natural logarithm of the ratio LF/HF. Each group shows three values: 24 h averages are plotted in black, night-time (left of black dot) and wake time averages (right of black dot) are plotted in grey. Note that ULF can only be calculated for the entire recording. The frequency domain measures were transformed by taking the natural logarithm to yield normal distributions (indicated by ‘ln ms2’). The symbol above a value/dot refers to comparisons within the same time period (24 h, night-time or wake time).* Group differed from 3 other groups. + Group differed from group <7 years and group 7 to 9 years. □ Group differed from group 7 to 9 years. ▵ Group differed from group 7 to 9 years and group 10 to 13 years.
Figure 6
Figure 6. Comparison of different age groups with respect to scaling and complexity measures.
Slope β – long-term fractal scaling properties, DFA α2 – intermediate-term fractal scaling properties, DFA α1 – short-term fractal scaling properties, ApEn - complexity. Each group shows three values: 24 h averages are plotted in black, night-time (left of black dot) and wake time averages (right of black dot) are plotted in grey. Note that the slope β can only be calculated for the entire recording. The symbol above a value/dot refers to comparisons within the same time period (24 h, night-time or wake time). * Group differed from 3 other groups. + Group differed from group <7 years and group 7 to 9 years. □ Group differed from group 7 to 9 years. ▵ Group differed from group 7 to 9 years and group 10 to 13 years.

References

    1. Malik M, Camm AJ. Armonk, NJ: Futura; 1995. Heart rate variability.
    1. Poon CS, Merrill CK. Decrease of cardiac chaos in congestive heart failure. Nature. 1997;389:492–495. - PubMed
    1. Ivanov PC, Amaral LAN, Goldberger AL, Havlin S, Rosenblum MG, et al. Multifractality in human heartbeat dynamics. Nature. 1999;399:461–465. - PubMed
    1. Task Force of the European Society of Cardiology and the North American Society of Pacing and Electrophysiology. Heart rate variability: standards of measurement, physiological interpretation, and clinical use. Circulation. 1996;93:1043–1065. - PubMed
    1. Pincus SM, Goldberger AL. Physiological time-series analysis: What does regularity quantify? Am J Physiol. 1994;266:H1643–H1656. - PubMed

Publication types