. 2011;6(5):e19805.
doi: 10.1371/journal.pone.0019805. Epub 2011 May 19.

Trade-off between toxicity and signal detection orchestrated by frequency- and density-dependent genes

Affiliations

Trade-off between toxicity and signal detection orchestrated by frequency- and density-dependent genes

Laury Arthaud et al. PLoS One. 2011.

Abstract

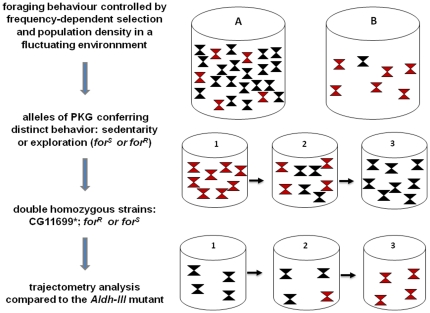
Behaviors in insects are partly highly efficient Bayesian processes that fulfill exploratory tasks ending with the colonization of new ecological niches. The foraging (for) gene in Drosophila encodes a cGMP-dependent protein kinase (PKG). It has been extensively described as a frequency-dependent gene and its transcripts are differentially expressed between individuals, reflecting the population density context. Some for transcripts, when expressed in a population at high density for many generations, concomitantly trigger strong dispersive behavior associated with foraging activity. Moreover, genotype-by-environment interaction (GEI) analysis has highlighted a dormant role of for in energetic metabolism in a food deprivation context. In our current report, we show that alleles of for encoding different cGMP-dependent kinase isoforms influence the oxidation of aldehyde groups of aromatic molecules emitted by plants via Aldh-III and a phosphorylatable adaptor. The enhanced efficiency of oxidation of aldehyde odorants into carboxyl groups by the action of for lessens their action and toxicity, which should facilitate exploration and guidance in a complex odor environment. Our present data provide evidence that optimal foraging performance requires the fast metabolism of volatile compounds emitted by plants to avoid neurosensory saturation and that the frequency-dependent genes that trigger dispersion influence these processes.


Conflict of interest statement

Competing Interests: The authors have declared that no competing interests exist.

Figures

Figure 1
Figure 1. Experimental scheme used in this study and illustration of density-dependent selection of genes in relation to phenotype transmission.
(left) Experimental design used to demonstrate the pleiotropic effects of the frequency- and density-dependent gene for. Double-hybrid system analysis has previously shown a strong probability of interaction (0.7) between CG11699 and Aldh-III and a lower probability (0.4) of association between CG11699 and PKG, the product of the gene for . The genetic backgrounds (expressing specific sets of transcripts of for) conferring the bimodal behaviors Rover (exploratory) or Sitter (sedentary) were crossed with two CG11699 mutants (containing P-element insertions) using chromosome balancers to construct the double homozygous strains CG11699*; forR and CG11699*; forS (see Table S1). These strains were then tested by trajectometry analysis using an arena connected to attractive odorants such as aldehyde compounds and compared with Aldh-III mutants. (right) A and B represent high- and low-density populations. Red and black triangles represent phenotypes determined by their corresponding expressed alleles (Rover, forR, black and Sitter, forS, red), dominant in each density context. The second line illustrates the flies from a low-density context raised at high density. The third line illustrates the opposite trend: flies from high-density context are raised at low-density. The progressive change of phenotypes is observed through few generations.
Figure 2
Figure 2. Benzaldehyde-induced response of double homozygous mutants bearing a CG11699 allele in a Rover or Sitter genetic background conferring distinct dispersive behavior.
Ten flies (five days old females in purple, males in blue) were starved for two hours before the start of the experiments and were then tested one by one. For quantification, four landmarks as described in Figure S1 were used to count the number of passages. The cumulative frequency of passages is shown. These experiments were of five minutes in duration, during which time the flies are walking (the periods of time during which the flies were immobile were not counted). R indicates the Rover background and S denotes the Sitter background (two variants of the for gene). CG11699* indicates a strain with a P-element insertion in this gene. CG11699*; R and CG11699*; S represent double homozygous strains (P-element insertions in CG11699 in the Rover or Sitter background). The scale of the ordinate axis (Y) represents 30, 60 and 90 passages. The protocol is described in Materials and Methods and in Figure S1. A mutant of Aldh-III (CG11140*) is shown for comparison. Mainly, Rover and Sitter gave similar results compared to Canton S (not shown): 90 and 85 passages for Canton S females and males respectively at the check point corresponding to the arrival of odorants versus 90 and 84 for R, 100 and 92 for S. These numbers of passages fall drastically for Aldh-III* (25 and 20), CG11699*(35 and 30), CG11699*; forR (45 and 50) and CG11699*; forS (35 and 25). Statistical analysis was performed using Paired t-test on individual performance of ten flies for each strain and results are reported in table S2.
Figure 3
Figure 3. Comparative propionaldehyde-induced behavioral response between strains.
Ten five days old female (black) and male (grey) flies were tested after two hours of starvation for propionaldehyde-induced exploration using the arena/air pusher system. This series of experiments was conducted during the odor gradient phase generated in the arena prior to reaching a uniform concentration (equal concentration between syringe and arena). Flies were tested for ten minutes, during which time they were active. (A) The ratio of time spent in the periphery versus the inside circle is indicated in the graph for the strains tested (1 corresponds to the entire time spent in the arena). (B) In another series of experiments, the passages in front of the two white oblong shapes and of the triangle were counted. The graph represents the ratio of passages in the triangle to the total (1 =  triangle plus the two white oblong shapes). Bars represent the mean +/− S.E. for ten flies (females or males). 1, forR; 2, forS; 3, Aldh-III*; 4, CG11699* (Szeged stock P-element insertion in CG11699); 5, CG11699**, [(EP)EP Berkeley project, P-element insertion in CG11699)]; 6, CS, Canton S; 7, CG11699**; forS; 8, CG11699**; forR; 9, CG11699*; forS and 10, CG11699*; forR. Mainly, the ratio of passages in the odor entry landmark (triangle) gave, respectively for females and males: forR, 0.8+/−0.1 and 0.4+/−0.05; forS, 0.75+/−0.05 and 0.5+/−0.05; Aldh-III*, 0.35+/−0.05 for both females and males; CG11699*, 0.3+/−0.05 and 0.38+/−0.1; CG11699*; forR, 0.3+/−0.15 and 0.35+/−0.1; CG11699*; forS, 0.3+/−0.1 and 0.35+/−0.1. Statistical analysis was performed with a Paired t-test on ten individuals for each strain and is reported in table S2.
Figure 4
Figure 4. Comparison of the exploration characteristics between strains stimulated by a cocktail of aldehyde compounds.
Five day old female and male flies were tested after two hours of starvation for their behavioral response using the arena/air pusher system and a cocktail of benzaldehyde/propionaldehyde/acetaldehyde at low concentrations (see Materials and Methods). The Y axis refers to the number of passages of individual flies in the four arena landmarks as indicated in the drawings. The experiment and the measurements were conducted in conditions where the flow of aldehyde compounds/air from the syringe creates a gradient in the arena. (A) For one series of experiments, the cumulative passages across the four landmarks were counted for a discontinuous period of ten minutes during which time the flies were active (discontinuous periods of time in which flies were immobile were not counted). Numbers represent the addition of three tested flies and bars represent the mean of five repeat experiments +/− S.E. (each repeat is the addition of three tested individual flies). (B) For another series of experiments, the passages in the blue triangle corresponding to the odor entry were counted. The discontinuous timing during which female Rover strain flies were active was measured for 100 passages. The average of ten Rover females was a time reference during which the other strains (female and male) were comparatively tested. The bars represent the mean+/− S.E. of five individual flies. 1, Rover; 2 Sitter; 3, Aldh-III*; 4, CG11699*; 5, CG11699**; 6, CS, Canton S; 7, CG11699*; forS; 8, CG11699*; forR; 9, CG11699**; forS; 10, CG11699**; forR. Mainly, the number of passages at the odor entry landmark gave: Rover, 100 (reference) and 80+/−15 for female and male respectively; CS, 95+/−18 and 80+/−10; S, 70+/−10 (female and male); CG11699*, 25+/−15 and 20+/−10; CG11699*; forR, 30+/−5 and 45+/−10; CG11699*; forS, 25+/−10 and 25+/−5. The statistical analysis using the Paired t-test was performed on the tested groups and is reported in table S2.
Figure 5
Figure 5. Behavioral responses induced by a high concentration of benzaldehyde.
One hundred flies (female and male, five days old) were transferred to a cage as shown on the left. This cage was then placed in a hood to enable a constant fresh air flow in contact with the sieves. A 50 µl aliquot of benzaldehyde was deposited on a plug made of foam rubber inside the cage. This high concentration induces deep sleep in Drosophila. The graphs represent the percentages of flies that are asleep, aggregated or immobile either on the plug (top) or on the sieves (bottom) during the time course of the experiment. Rover, forR; Sitter, forS; CG11699*, P-element insertion in CG11699 (Bloomington Stock Center); CG11140*, Aldh-III mutant. CG11699*; R and CG11699*; S are the double homozygous mutants. Plots are the average of five experiments. CG11140* gave about 100% of flies aggregated on the plug and 0% on the windows at the equilibrium. The numbers were opposite for the other strains (about 0% and 100% respectively).
Figure 6
Figure 6. Aldh activity analysis in strains presenting high or low levels of PKA or high levels of PKG and effect of benzaldehyde exposure on the lifespan of flies.
(A) Ten flies (female and male), submitted (grey) or not (black) to heat shock, were decapitated and the membrane head extracts were assayed for Aldh activity using 100 µg of membrane proteins and benzaldehyde as substrate (see Materials and Methods). The dnc mutant has high levels of cAMP due to a defect in phosphodiesterase. The rut mutant presents a low level of cAMP due to a cyclase defect. hsp-PKG is a transgenic fly bearing the for transgene responsible for the dispersion behavior under the heat shock promoter in a Sitter background. The determination obtained with the CS extract was a reference to compare the other strains. Bars are the mean of five experiments +/−S.E. *p<0,001. (B) Aldh activity in third instar larvae in the hsp-PKG strain with or without heat shock prior to the dosage. Bars represent the mean of 3 experiments+/−S.E., *p<0,001. (C) For the lethality, 50 five days old flies (female and male) were exposed to a high concentration of benzaldehyde in a food vial for five minutes (10 µl benzaldehyde deposited on paper) and this was repeated three times on day 5. Lethality was counted one week after. Aldh-III* and CG11699* mutants were assayed versus CS as control. Bars are the mean of five experiments +/−S.E., *p<0.0005 Student's t-test for benzaldehyde exposure of Aldh-III* and CG11699* versus CS for the heat shock experiments. (D) Third instar hsp-PKG larvae (50 larvae) with or without heat shock were exposed to a high concentration of benzaldehyde (10 µl benzaldehyde deposited on paper, 3 times) in a food vial for one day. Then, the flies that emerged from pupae were counted. Bars are the mean of three separate experiments +/−S.E., *p<0,005 and represent the ratio of surviving adult flies versus the control (hsp-PKG without heat shock). The forS strain is shown as the background in which hsp-PKG transgene has been introduced.
Figure 7
Figure 7. Aldh activity analysis of S2 cells after treatment with kinase activators.
(A) Aldh activity using benzaldehyde as substrate was determined by measuring the spectrophotometric absorbance (OD) at 340 nm, which specifically quantifies the amount of reduced co-enzyme (NADH, NADPH). The main graph is representative of the Aldh activity from cells previously treated with 50 µM Br-cGMP, 50 µM Br-cAMP or 1 µM phorbol ester. These stable pharmacological agents activate the PKG (encoded by for), PKA and PKC kinases, respectively. The curves are the means of three separate determinations. Inserted above the curves, is the PCR analysis of the transcript of CG11699 (1) in the sub-clone of S2 cells used in this series of experiments and of its genomic fragment (2) (see figure S4 for the primers). To summarize, Br-cGMP treatment gave 1.3 versus 0.9 for the control. (B) The graph represents the comparative mean+/− S.E. of five determinations of the total activity in membranes of the adult CS heads. The pharmacological agents plus ATP (50 µM) and Mg++ (1 mM) had been previously incubated with the crude extract prior to the enzymatic determinations. The Drosophila head membrane extracts gave 1.8+/−0.25 for Br-cGMP treatment versus 1.5+/−0.15 for Br-cAMP and 1.2+/−0.1 for phorbol ester. Control versus Br-cGMP Student's t-test: p<0.005. (C) PCR analysis using total RNA from S2 cells used in this series of experiment was performed to determine the presence of Aldh-III transcripts. 100 bp markers (Invitrogen) were used (the most intense band is at 600 bp). Lane 1, Aldh1/Aldh5 corresponding to transcripts A–H (240 bp); lane 2, Aldh2/Aldh5 corresponding to transcripts C, G and H (430 bp); lane 3, Aldh3/Aldh6 corresponding to transcripts A and C (300 bp); lane 4, Aldh4/Aldh6 corresponding to transcripts A, C, and H (300 bp). See figure S4 for the design and the location of the primers. (D) The comparative dosage of Aldh activity was also determined with 100 µg of total membrane proteins from extracts of CS (used as control), CG11699* and Aldh-III* mutant adult flies (five days old) using the same protocol. Bars represent the mean of three separate experiments +/− S.E.
Figure 8
Figure 8. Aldh activity analysis of S2 cells stably transfected with a CG11699 transgene.
S2 cells were stably transfected with an expression vector bearing the CG11699 coding sequence. A stable cell line expressing CG11699 was generated by transfection with a plasmid containing CG11699-pMT/V5-His and pCoHygro (the E. coli hygromycin-B phosphotransferase gene under the control of a Drosophila Copia promoter). Stable cells were treated with 0.5 mM CuSO4 for 24 hr to induce CG11699 expression before use. (A) Electrophoresis protein gel analysis: lane 1, total extracts of control cells; lane 2, total extracts of transfected cells; lane 3, soluble extracts of transfected cells; lane 4, soluble extracts of transfected cells after induction; lane 5, membrane extracts of transfected cells; lane 6, membrane extracts of transfected cells after induction. A Western blot analysis shows the presence of the expressed transgene using anti-V5 tag in the membrane fraction. (B) The induction of stably transfected cells was carried out one day prior to Aldh activity analysis. The cells were then disrupted by osmotic shock followed by brief sonication. The resulting extracts were briefly centrifuged to remove nuclei and organelles. The supernatant was again centrifuged to pellet the membrane fraction (13000 rpm for 30 minutes at 4°C) and the Aldh dosage was carried out for both components (soluble and membrane). The same amount of protein was used for the soluble fraction (100 µg) and for the membrane fraction (200 µg). Membranes were incubated or not with PKA subunit (10 units), ATP (50 µM) and Mg++ (1 mM) prior to Aldh activity determination. The curves represent the average of three determinations. (C) Comparative levels of Aldh-III activity in the membrane component from stably induced transfected cells, incubated or not with Br-cGMP and/or Br-cAMP three hours before the experiment. 1, control induced transfected cells; 2, induced transfected cells treated with Br-cGMP; 3, induced transfected cells treated with Br-cAMP; 4, control non transfected cells (with the inducer) treated with Br-cGMP. The bars represents the mean+/− S.E. of three individual determinations. p<0.001 Student's t-test between tracks 1 and 2. We observed elevated levels of Aldh activity after Br-cGMP treatment (0,8 +/− 0,15 for the non transfected cell control treated with the inducer versus 1,7+/− 0,15 for the induced transfected cells after br-cGMP treatment in both cases).

References

    1. Peng TX, Moya A, Ayala FJ. Two modes of balancing selection in Drosophila melanogaster: overcompensation and overdominance. Genetics. 1991;128:381–391. - PMC - PubMed
    1. Tosić M, Ayala FJ. Density- and frequency-dependent selection at the Mdh-2 locus in Drosophila pseudoobscura. Genetics. 1981;97:679–701. - PMC - PubMed
    1. Jorde PE, Ryman N. Temporal allele frequency change and estimation of effective size in populations with overlapping generations. Genetics. 1995;139:1077–1090. - PMC - PubMed
    1. Asmussen MA. Density-dependent selection incorporating intraspecific competition. II. A diploid model. Genetics. 1983;103:335–350. - PMC - PubMed
    1. Kopp M, Hermisson J. The evolution of genetic architecture under frequency-dependent disruptive selection. Evolution. 2006;60:1537–1550. - PubMed

Publication types

Substances

LinkOut - more resources