. 2011 May;7(5):e1001138.
doi: 10.1371/journal.pcbi.1001138. Epub 2011 May 19.

deFuse: an algorithm for gene fusion discovery in tumor RNA-Seq data

Affiliations

deFuse: an algorithm for gene fusion discovery in tumor RNA-Seq data

Andrew McPherson et al. PLoS Comput Biol. 2011 May.

Abstract

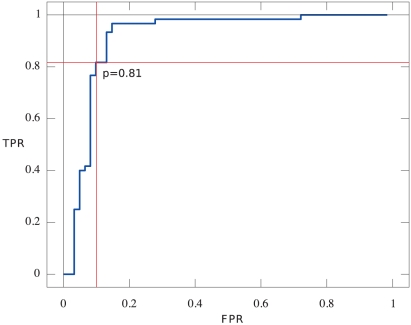
Gene fusions created by somatic genomic rearrangements are known to play an important role in the onset and development of some cancers, such as lymphomas and sarcomas. RNA-Seq (whole transcriptome shotgun sequencing) is proving to be a useful tool for the discovery of novel gene fusions in cancer transcriptomes. However, algorithmic methods for the discovery of gene fusions using RNA-Seq data remain underdeveloped. We have developed deFuse, a novel computational method for fusion discovery in tumor RNA-Seq data. Unlike existing methods that use only unique best-hit alignments and consider only fusion boundaries at the ends of known exons, deFuse considers all alignments and all possible locations for fusion boundaries. As a result, deFuse is able to identify fusion sequences with demonstrably better sensitivity than previous approaches. To increase the specificity of our approach, we curated a list of 60 true positive and 61 true negative fusion sequences (as confirmed by RT-PCR), and have trained an adaboost classifier on 11 novel features of the sequence data. The resulting classifier has an estimated value of 0.91 for the area under the ROC curve. We have used deFuse to discover gene fusions in 40 ovarian tumor samples, one ovarian cancer cell line, and three sarcoma samples. We report herein the first gene fusions discovered in ovarian cancer. We conclude that gene fusions are not infrequent events in ovarian cancer and that these events have the potential to substantially alter the expression patterns of the genes involved; gene fusions should therefore be considered in efforts to comprehensively characterize the mutational profiles of ovarian cancer transcriptomes.


Conflict of interest statement

The authors have declared that no competing interests exist.

Figures

Figure 1
Figure 1. The deFuse gene fusion discovery method.
a) Discordant alignments are clustered based on the likelihood that those alignments were produced by reads spanning the same fusion boundary. Ambiguous alignments are resolved by selecting the most likely set of fusion events, and the most likely assignment of paired end reads to those events, and the remaining alignments are discarded. b) Paired end reads with an alignment for which one end aligns near the approximate fusion boundary are mined for split alignments of the other end of the read. c) The predicted fusion boundary is used to calculate the fragment lengths for each spanning paired end read. These fragment lengths are tested for the hypothesis that they were drawn at random from the fragment length distribution.
Figure 2
Figure 2. Conditions for considering two paired end reads to have originated from the same fusion transcript.
a) Fusion transcript X-Y supported by a paired end read spanning the fusion boundary. b) Discordant paired end reads represent reads potentially spanning a fusion boundary. Each discordant alignment suggests fusion boundaries in the regions adjacent to the alignments in each transcript. The fusion boundary region, shown in gray, is the region in which we expect a fusion boundary to occur. c) The overlapping boundary region condition is the condition that the fusion boundary regions in each transcript must overlap. d) The difference between the fragment lengths of two paired end reads spanning a fusion boundary is formula image
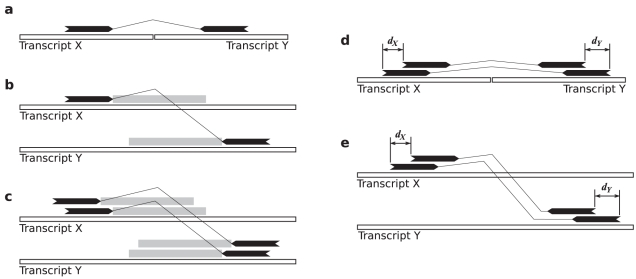
. e) The similar fragment length condition is the constraint that formula image must be no more than formula image.
Figure 3
Figure 3. Searching for candidate split reads.
a) Approximate fusion boundaries, shown as dashed rectangles, are the intersection of fusion boundary regions for discordant alignments supporting a potential fusion. b) The mate alignment region, shown as a dashed rectangle, is the union of possible alignment locations for the other end of a single end anchored alignment. c) The approximate fusion boundary in transcript formula image 
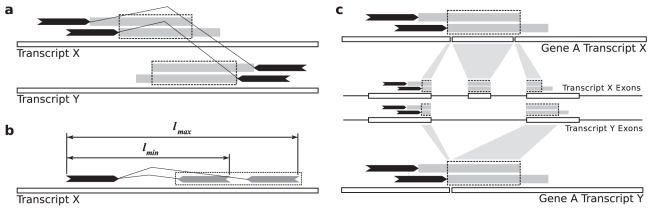
is projected into transcript formula image by remapping the start of the approximate fusion boundary from formula image, to the genome, to formula image.
Figure 4
Figure 4. deFuse ROC curve.
ROC curve for deFuse annotated with the threshold for the adaboost probability estimate. The threshold corresponds to a false positive rate of 10% and true positive rate of 82%.
Figure 5
Figure 5. Variable importance plot for deFuse classifier.
Relative importance of each of the 11 features used by deFuse classifier.
Figure 6
Figure 6. Evidence for the FRYL-SH2D1A fusion showing the validated fusion boundary (vertical red line).
a) Validation evidence using a FISH come together assay, with fusion probes circled in white. b) FISH probe selection. c) FRYL exonic coverage showing fewer reads aligning after the fusion boundary. FRYL exons in blue with narrower boxes denoting untranslated sequence. d) SH2D1A exonic coverage showing significant coverage after the fusion boundary. SH2D1A exons in green with narrower boxes denoting untranslated sequence. e, FRYL-SH2D1A exons in blue or green depending on their origin, with the whole transcript predicted as untranslated. f) Positions of spanning reads supporting the fusion. g, Split alignments supporting the fusion prediction. h) Chromatogram of a sequenced PCR product supporting the fusion.
Figure 7
Figure 7. Fusions in sarcoma samples.
a) Read depth across HNF1A exonic positions shows that only the region after the fusion boundary is being expressed, evidence of the possible biallelic inactivation of HNF1A. b) Putative RREB1-TFE3 chimeric protein showing preservation of TFE3's basic helix-loop-helix (bHLH) leucine zipper (LZ) domain and N-terminal activation domain (ATA), in addition to 4 of RREB1's zinc finger (ZF) motifs.

References

    1. Tomlins SA, Laxman B, Dhanasekaran SM, Helgeson BE, Cao X, et al. Distinct classes of chromosomal rearrangements create oncogenic ETS gene fusions in prostate cancer. Nature. 2007;448:595–599. - PubMed
    1. Mitelman F, Johansson B, Mertens F. The impact of translocations and gene fusions on cancer causation. Nat Rev Cancer. 2007;7:233–245. - PubMed
    1. Tognon C, Knezevich SR, Huntsman D, Roskelley CD, Melnyk N, et al. Expression of the ETV6-NTRK3 gene fusion as a primary event in human secretory breast carcinoma. Cancer Cell. 2002;2:367–376. - PubMed
    1. Soda M, Choi YL, Enomoto M, Takada S, Yamashita Y, et al. Identification of the transforming EML4-ALK fusion gene in non-small-cell lung cancer. Nature. 2007;448:561–566. - PubMed
    1. Aplan PD. Causes of oncogenic chromosomal translocation. Trends Genet. 2006;22:46–55. - PMC - PubMed

Publication types