Multicenter Study
. 2011 Sep 29;118(13):3512-24.
doi: 10.1182/blood-2010-12-328252. Epub 2011 May 31.

Pharmacogenomics of bortezomib test-dosing identifies hyperexpression of proteasome genes, especially PSMD4, as novel high-risk feature in myeloma treated with Total Therapy 3

Affiliations
Multicenter Study

Pharmacogenomics of bortezomib test-dosing identifies hyperexpression of proteasome genes, especially PSMD4, as novel high-risk feature in myeloma treated with Total Therapy 3

John D Shaughnessy Jr et al. Blood. .

Abstract

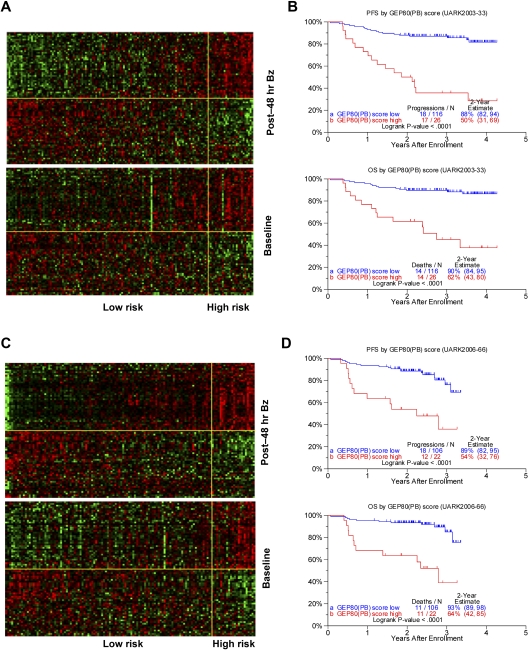
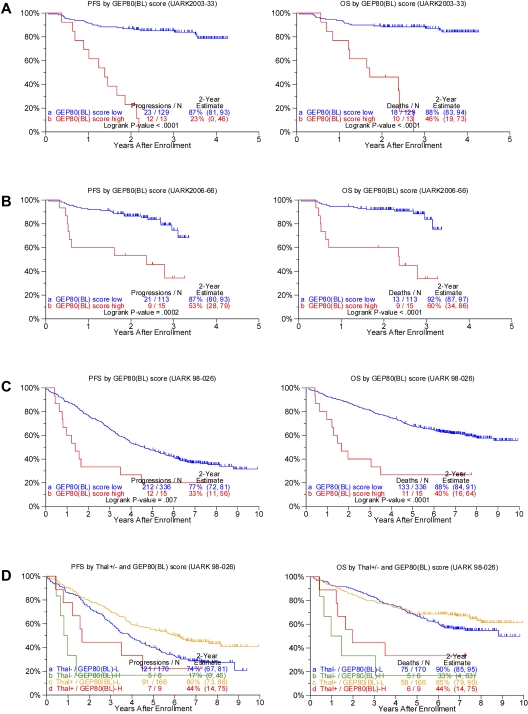
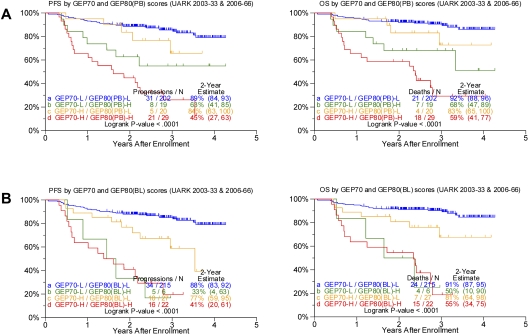
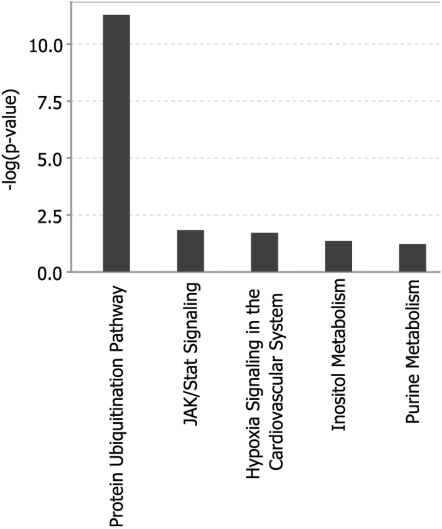
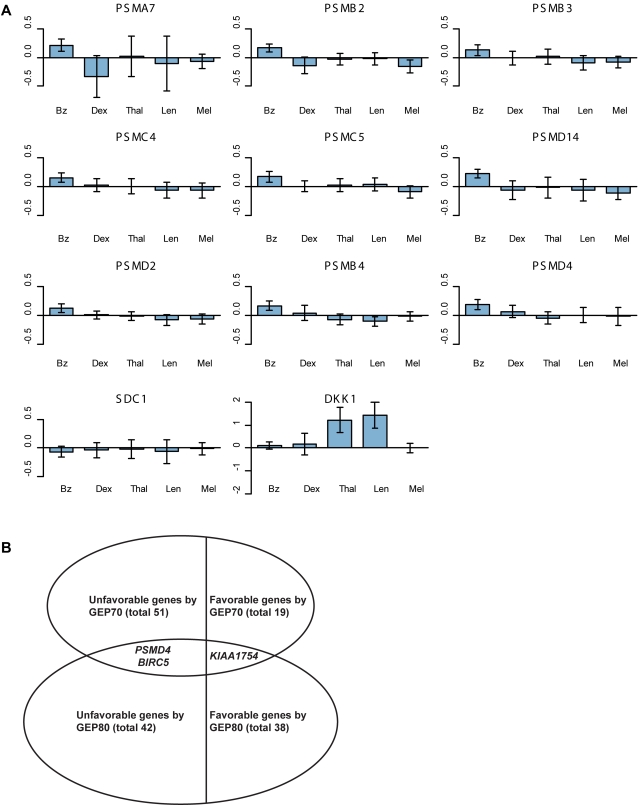
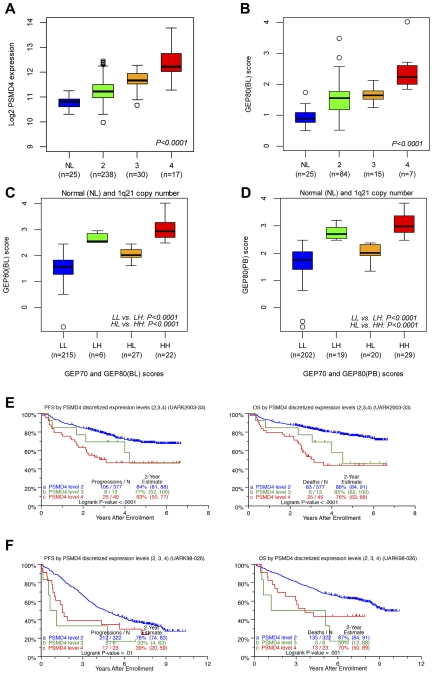
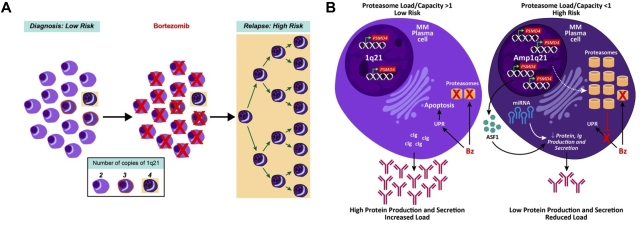
Gene expression profiling (GEP) of purified plasma cells 48 hours after thalidomide and dexamethasone test doses showed these agents' mechanisms of action and provided prognostic information for untreated myeloma patients on Total Therapy 2 (TT2). Bortezomib was added in Total Therapy 3 (TT3), and 48 hours after bortezomib GEP analysis identified 80 highly survival-discriminatory genes in a training set of 142 TT3A patients that were validated in 128 patients receiving TT3B. The 80-gene GEP model (GEP80) also distinguished outcomes when applied at baseline in both TT3 and TT2 protocols. In context of our validated 70-gene model (GEP70), the GEP80 model identified 9% of patients with a grave prognosis among those with GEP70-defined low-risk disease and 41% of patients with favorable prognosis among those with GEP70-defined high-risk disease. PMSD4 was 1 of 3 genes common to both models. Residing on chromosome 1q21, PSMD4 expression is highly sensitive to copy number. Both higher PSMD4 expression levels and higher 1q21 copy numbers affected clinical outcome adversely. GEP80 baseline-defined high risk, high lactate dehydrogenase, and low albumin were the only independent adverse variables surviving multivariate survival model. We are investigating whether second-generation proteasome inhibitors (eg, carfilzomib) can overcome resistance associated with high PSMD4 levels.


Figures

Figure 1
Figure 1
Development and validation of post-Bz–based GEP80 predictive model. (A) Heat map of GEP80 expression levels 48 hours after Bz administration (top) and at baseline (bottom) in training set of 142 patients enrolled in the UARK2003-33 TT3A protocol. In both panels, samples are represented in columns and genes in rows. Each column represents one patient, and each row represents one gene. Samples are ordered by ascending GEP80(PB) score, which is indicated by the green bar on the top, and genes are ordered by hierarchical cluster analysis. The horizontal yellow line separates the unfavorable genes (above yellow line) from the favorable genes (below yellow line) in each panel. The vertical yellow line separates the low-risk (left of yellow line) from the high-risk patients (right of yellow line). (B) The GEP80(PB) model distinguishes between high-risk and low-risk patients in the training set, reflected in significantly different PFS (top) and OS (bottom). (C) Heat map of GEP80 expression levels 48 hours after Bz administration (top) and at baseline (bottom) in test set of 128 patients enrolled in the UARK2006-66 TT3B protocol. In both panels, samples are represented in columns and genes in rows. Each column represents one patient, and each row represents one gene. Samples are ordered by ascending GEP80(PB) score, which is indicated by the green bar on the top, and genes are ordered by hierarchical cluster analysis. The horizontal yellow line separates the unfavorable genes (above yellow line) from the favorable genes (below yellow line) in each panel. The vertical yellow line separates the low-risk (left of yellow line) from the high-risk patients (right of yellow line). (D) The GEP80(PB) model distinguishes between high-risk and low-risk patients in the test set, reflected in significantly different PFS (top) and OS (bottom).
Figure 2
Figure 2
Applying the GEP80 model developed from the 48-hour post-Bz setting to baseline expression levels to divide patients into high- and low-risk groups. (A) Superior PFS (left) and OS (right) were noted in the low-risk group when applied to the training set of 142 patients receiving TT3A (UARK2003-33). (B) Superior PFS (left) and OS (right) were confirmed in the low-risk group when applied to the test set of 128 patients receiving TT3B (UARK2006-66). (C) Superior PFS (left) and OS (right) were noted in the low-risk group when applied to all 351 patients with GEP data before starting TT2 (UARK98-026, both arms combined). (D) Superior PFS (left) and OS (right) were also noted in the low-risk group (GEP80(BL)–L) compared with the high-risk group (GEP80(BL)–H) when examined separately by control arm (Thal; P = .03 and .0002, respectively) and experimental arm (Thal+) in the TT2 protocol (P = .04 and .007, respectively).
Figure 3
Figure 3
Comparing survival outcomes in TT3 (UARK2003-33 and 2006-66 combined) according to GEP70, GEP80(PB), and GEP80(BL) scores. (A) PFS (left) and OS (right) in both GEP70 low- and high-risk settings could be further discriminated by the GEP80(PB) model. Best outcomes were observed in patients with GEP70 low-risk and GEP80(PB) low-risk (LL) features, followed by patients with GEP70 high-risk and GEP80(PB) low-risk (HL) features and patients with GEP70 low-risk and GEP80(PB) high-risk (LH) features; worst outcomes were observed in patients with GEP70 high-risk and GEP80(PB) high-risk (HH) characteristics. The LH group exhibited poorer survival than the HL group; however, no significant differences were observed between the 2 groups (P = .216 and .268 for PFS and OS, respectively). (B) PFS (left) and OS (right) in both GEP70 low- and high-risk settings could be further discriminated by the GEP80(BL) model. Best outcomes were observed in patients with GEP70 low-risk and GEP80(BL) low-risk (LL) features, followed by patients with GEP70 high-risk and GEP80(BL) low-risk (HL) features and patients with GEP70 low-risk and GEP80(BL) high-risk (LH) features; worst outcomes were observed in patients with GEP70 high-risk and GEP80(BL) high-risk (HH) characteristics. The LH group exhibited poorer survival than the HL group, and, importantly, significant differences were observed between the 2 groups (P = .05 and .02 for PFS and OS, respectively).
Figure 4
Figure 4
Analysis of the 80 genes of the GEP80 model shows the protein ubiquitination pathway to be primarily affected.
Figure 5
Figure 5
Alterations in proteasome gene expression and favorable and unfavorable genes. (A) Bar plots of alterations in proteasome (PSM) gene expression within 48 hours of test-dosing with Bz in TT3 versus dexamethasone (Dex) in the control arm of TT2, thalidomide (Thal) in the experimental arm of TT2, lenalidomide (Len) in a phase 2 trial and melphalan (Mel) in TT4 (applied 48 hours after Bz test-dosing). Within each plot, the heights of the bars indicate the mean expression changes within 48 hours of drug administration; the vertical line on each bar represents a 95% confidence interval, indicating significant (or nonsignificant) changes when not crossing (or crossing) the x-axis. These bar plots show that the PSM genes were uniquely altered significantly by Bz but not by the other agents. (B) Total number of favorable/unfavorable genes and the genes overlapping in the GEP70 and GEP80 models.
Figure 6
Figure 6
Relationships of PSMD4 expression levels, chromosome 1q21 copy number, and GEP80 risk scores. (A) Box plot of baseline PSMD4 expression level in normal donors (NLs) and in patients with multiple myeloma with 1q21 (CKS1B) DNA copy numbers of 2, 3, and ≥4 from interphase FISH experiment. The plot shows that PSMD4 expression levels were highly correlated with 1q21 (CKS1B) copy number (P < .0001). (B) Box plot of the GEP80(BL) score in normal donors (NLs) and in patients with multiple myeloma with 1q21 copy numbers of 2, 3, and ≥ 4, showing increased risk score with higher copy number. (C) Box plot of GEP80(BL) score in risk groups defined by GEP70 and GEP80(BL) models: low 70-gene risk/low 80-gene risk (LL), low 70-gene risk/high 80-gene risk (LH), high 70-gene risk/low 80-gene risk (HL), and high 70-gene risk/high 80-gene risk (HH). (D) Box plot of GEP80(PB) score in risk groups defined by GEP70 and GEP80(PB) models: low 70-gene risk/low 80-gene risk (LL), low 70-gene risk/high 80-gene risk (LH), high 70-gene risk/low 80-gene risk (HL), and high 70-gene risk/high 80-gene risk (HH). (E) PFS (left) and OS (right) in TT3 (UARK2003-33) according to the PSMD4 expression levels (low, medium, and high) corresponding to 1q21 (CKS1B) copy number (2, 3, and 4). Note the graded effect of increasing PSMD4 levels on shortening PFS and OS in the case of TT3. (F) PFS (left) and OS (right) in TT2 (UARK98-026) according to the PSMD4 expression levels (low, medium, and high) corresponding to 1q21 (CKS1B) copy number (2, 3, and 4). Only patients with low-tertile PSMD4 expression levels fare better.
Figure 7
Figure 7
Proposed model of high-risk multiple myeloma development in reference to 1q21/PSMD4 copy number. (A) At time of first presentation, low-risk multiple myeloma has cells with variable 1q21/PSMD4 copy number (2, 3, or 4), whereby higher copy numbers are associated with Bz resistance. (B) A major mechanism of Bz's action could be to upset the protein load to protein capacity (PL:PC) balance in the myeloma cells. This imbalance leads to unfolded protein response (UPR)–induced apoptosis. The 4-copy 1q21/PSMD4 myeloma cells have an expanded proteasome and global increase in miRNAs, which causes increased protein capacity and decreased protein production. At relapse, the 4-copy myeloma cells are able to evade the UPR.

References

    1. Palumbo A, Bringhen S, Liberati AM, et al. Oral melphalan, prednisone, and thalidomide in elderly patients with multiple myeloma: updated results of a randomized controlled trial. Blood. 2008;112(8):3107–3114. - PubMed
    1. Palumbo A, Falco P, Corradini P, et al. Melphalan, prednisone, and lenalidomide treatment for newly diagnosed myeloma: a report from the GIMEMA–Italian Multiple Myeloma Network. J Clin Oncol. 2007;25(28):4459–4465. - PubMed
    1. San Miguel JF, Schlag R, Khuageva NK, et al. Bortezomib plus melphalan and prednisone for initial treatment of multiple myeloma. N Engl J Med. 2008;359(9):906–917. - PubMed
    1. Mateos MV, Oriol A, Martinez-Lopez J, et al. Bortezomib, melphalan, and prednisone versus bortezomib, thalidomide, and prednisone as induction therapy followed by maintenance treatment with bortezomib and thalidomide versus bortezomib and prednisone in elderly patients with untreated multiple myeloma: a randomised trial. Lancet Oncol. 2010;11(10):934–941. - PubMed
    1. Pineda-Roman M, Zangari M, Haessler J, et al. Sustained complete remissions in multiple myeloma linked to bortezomib in total therapy 3: comparison with total therapy 2. Br J Haematol. 2008;140(6):625–634. - PMC - PubMed

Publication types

MeSH terms