. 2011 Jul 1;124(Pt 13):2143-52.
doi: 10.1242/jcs.080762. Epub 2011 May 31.

Increased ER-mitochondrial coupling promotes mitochondrial respiration and bioenergetics during early phases of ER stress

Affiliations

Increased ER-mitochondrial coupling promotes mitochondrial respiration and bioenergetics during early phases of ER stress

Roberto Bravo et al. J Cell Sci. .

Abstract

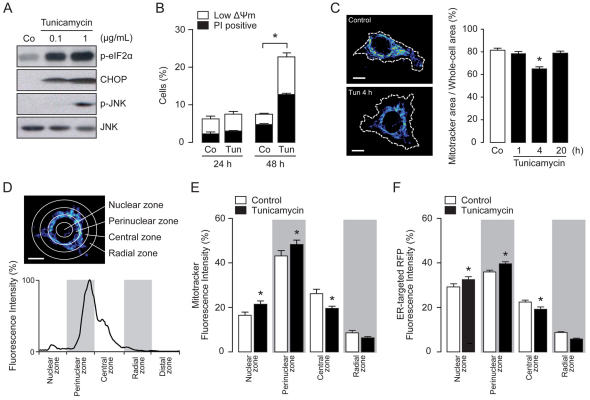
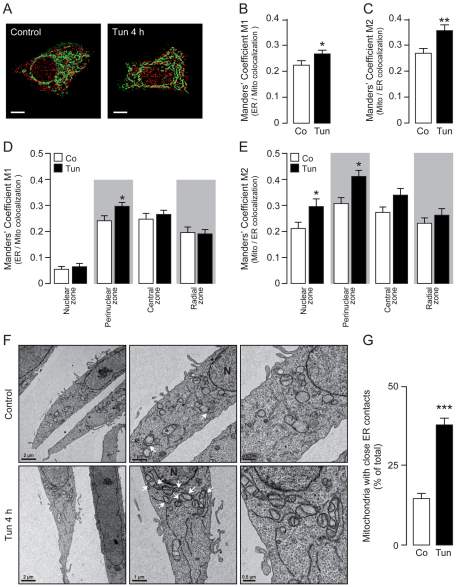
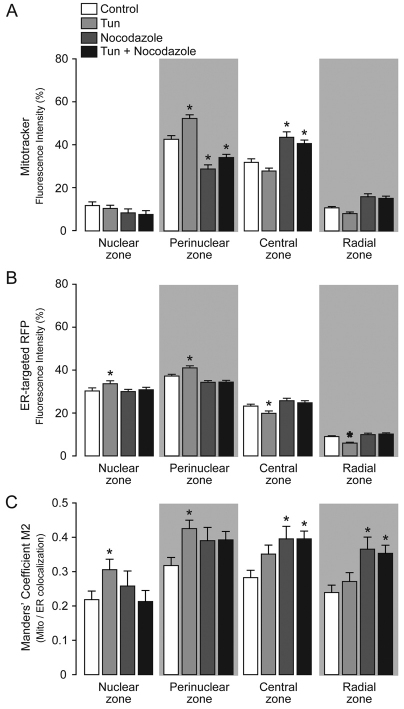
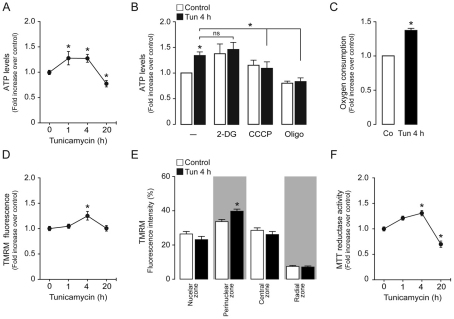
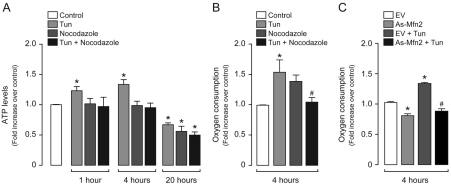
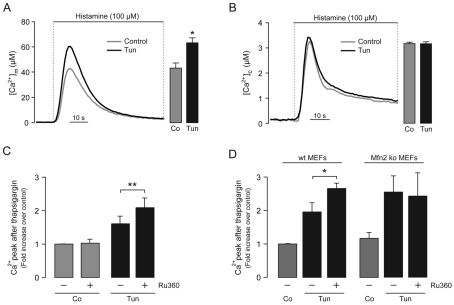
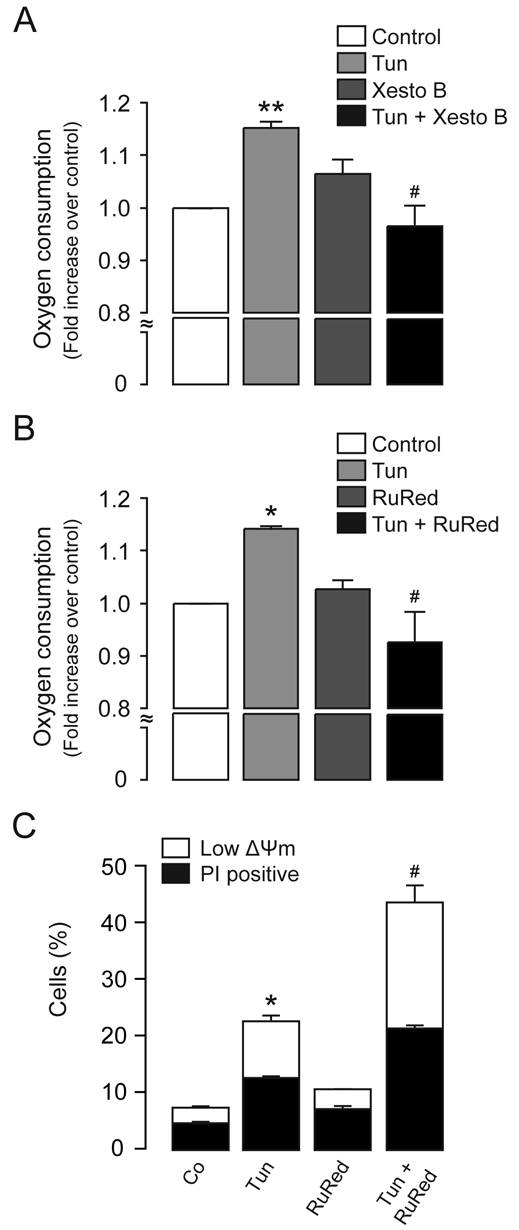
Increasing evidence indicates that endoplasmic reticulum (ER) stress activates the adaptive unfolded protein response (UPR), but that beyond a certain degree of ER damage, this response triggers apoptotic pathways. The general mechanisms of the UPR and its apoptotic pathways are well characterized. However, the metabolic events that occur during the adaptive phase of ER stress, before the cell death response, remain unknown. Here, we show that, during the onset of ER stress, the reticular and mitochondrial networks are redistributed towards the perinuclear area and their points of connection are increased in a microtubule-dependent fashion. A localized increase in mitochondrial transmembrane potential is observed only in redistributed mitochondria, whereas mitochondria that remain in other subcellular zones display no significant changes. Spatial re-organization of these organelles correlates with an increase in ATP levels, oxygen consumption, reductive power and increased mitochondrial Ca²⁺ uptake. Accordingly, uncoupling of the organelles or blocking Ca²⁺ transfer impaired the metabolic response, rendering cells more vulnerable to ER stress. Overall, these data indicate that ER stress induces an early increase in mitochondrial metabolism that depends crucially upon organelle coupling and Ca²⁺ transfer, which, by enhancing cellular bioenergetics, establishes the metabolic basis for the adaptation to this response.


Figures

Fig. 1.
Fig. 1.
Mitochondria translocate to perinuclear ER during early phases of ER stress. (A) Western blot analysis of HeLa cells treated for 4 hours with tunicamycin (Tun) as indicated. (B) The quantification of dead cells (PI positive) and cells with a low ΔΨm [low DiOC6(3) staining] after treatment with 1 μg/ml tunicamycin was determined by flow cytometry. (C) Confocal images of Mitotracker-Green-stained mitochondria in control cells or cells treated with 0.5 μg/ml tunicamycin for 4 hours. Quantification of the percentage ratio of mitochondrial area:whole cell area is shown for HeLa cells treated with 0.5 μg/ml tunicamycin as indicated. Co, control (untreated). (D) Example of the radial fluorescence analysis of subcellular zones. (E,F) Quantification of the radial fluorescence of control cells or cells treated with 0.5 μg/ml tunicamycin for 4 hours. Data are means ± s.e.m. *P<0.05 compared with controls within the same subcellular zone or as indicated. Scale bars: 10 μm.
Fig. 2.
Fig. 2.
ER–mitochondrial coupling observed during early phases of ER stress. (A) Confocal images of HeLa cells transiently expressing ER-targeted RFP (red) and stained with Mitotracker Green (green), either treated with 0.5 μg/ml tunicamycin (Tun) for 4 hours or left untreated (control). Scale bars: 10 μm. (B,C) Quantification of the Manders' coefficient M1 (fraction of ER in colocalization with mitochondria) or M2 (fraction of mitochondria in colocalization with ER). (D,E) Quantification of the M1 and M2 coefficients within the predefined subcellular regions. (F) Representative transmission electron microscopy images from control cells or cells treated with 0.5 μg/ml tunicamycin for 4 hours. Three different magnifications of the same cell are shown. Close ER–mitochondrial contacts are indicated only in the middle panel by white arrows. Scale bars: 0.5, 1 and 2 μm as indicated. N, nucleus. (G) Quantification of the percentage of mitochondria with close ER contacts per field. Co, control (untreated). Data are means ± s.e.m. *P<0.05; **P<0.01; ***P<0.001 compared with respective controls or controls in the same subcellular zone.
Fig. 3.
Fig. 3.
Mitochondrial rearrangement requires an intact microtubular network. (A) Analysis of the radial fluorescence of Mitotracker-stained control HeLa cells or cells treated for 4 hours with 0.5 μg/ml tunicamycin (Tun) in combination with 10 μM nocodazole, as indicated by the grayscale blocks. (B) Analysis of the radial fluorescence of transiently expressing ER-targeted RFP HeLa cells that were untreated (control) or treated with tunicamycin in combination with nocodazole as indicated by grayscale blocks as in A. (C) Quantification of the Manders' coefficient M2 (fraction of mitochondria in colocalization with ER) within the predefined subcellular zones for cells expressing ER-targeted RFP and stained with Mitotracker Green. Grayscale indicates the groups as described in A. Data are means±s.e.m. *P<0.05 compared with control cells within the same subcellular zone.
Fig. 4.
Fig. 4.
Increase in cellular bioenergetics during early phases of ER stress. (A) Quantification of intracellular ATP levels in HeLa cells treated with 0.5 μg/ml tunicamycin (Tun) for the times indicated. (B) Quantification of intracellular ATP levels in cells treated for 4 hours with 0.5 μg/ml tunicamycin, in combination with 20 mM 2-DG, 20 μM CCCP or 1 μM oligomycin. (C) Determination of oxygen consumption in control cells, or cells treated with 0.5 μg/ml tunicamycin for 4 hours. Co, control (untreated). (D) Determination of ΔΨm in TMRM-stained HeLa cells treated with 0.5 μg/ml tunicamycin as indicated. (E) Analysis of the radial fluorescence of TMRM-stained HeLa cells treated with 0.5 μg/ml tunicamycin for 4 hours. (F) Determination of reductive power and cell viability, through an MTT reductase activity assay, in HeLa cells treated with 0.5 μg/ml tunicamycin for the indicated times. Data are means±s.e.m. *P<0.05 compared with respective controls or as indicated.
Fig. 5.
Fig. 5.
Metabolic enhancement requires an intact microtubular network. (A) Intracellular ATP levels were measured in control (untreated) HeLa cells, or cells treated with 0.5 μg/ml tunicamycin (Tun) in combination with 10 μM nocodazole as indicated. (B) Oxygen consumption was determined in control HeLa cells or cells treated with 0.5 μg/ml tunicamycin in combination with 10 μM nocodazole as indicated. (C) Oxygen consumption was determined in HeLa cells transduced with adenovirus encoding antisense mitofusin 2 (AsMfn2) or transduced with the empty vector (EV), and treated with 0.5 μg/ml tunicamycin in combination with 10 μM nocodazole as indicated. Data are means±s.e.m. *P<0.05 compared with untreated controls; #P<0.05 compared with tunicamycin alone (B) or tunicamycin plus EV (C).
Fig. 6.
Fig. 6.
Augmented mitochondrial Ca2+ uptake during early phases of ER stress. (A) Representative traces of mitochondrial [Ca2+] ([Ca2+]m) obtained from HeLa cells expressing mitochondrial aequorin, either untreated (Co, control) or treated with 1 μg/ml tunicamycin (Tun) for 4 hours prior to histamine addition. Statistical analysis of the peak [Ca2+]m is presented in the bar graph. (B) Representative traces of cytosolic [Ca2+] ([Ca2+]c) obtained from HeLa cells expressing cytosolic aequorin, either untreated or treated with 1 μg/ml tunicamycin for 4 hours prior to histamine addition. Statistical analysis of the peak [Ca2+]c is presented in the bar graph. (C) HeLa cells were treated for 4 hours with 1 μg/ml tunicamycin and loaded with Fura-2 for cytosolic Ca2+ measurements. ER Ca2+ depletion was induced by addition of 1 μM thapsigargin, in the presence of 10 μM Ru360 as indicated. Peak values reflecting the kinetics after ER Ca2+ depletion are presented, normalized to those in control cells. (D) The same protocol as in C was used in wild-type (wt) MEFs or mitofusin2-knockout (Mfn2 ko) MEFs. Peak values reflecting the kinetics after ER Ca2+ depletion are presented, normalized to those in control wild-type MEFs. Data are means±s.e.m. (A and B) and means±s.d. (C and D). *P<0.05 compared with untreated controls or as indicated. **P<0.01 as indicated.
Fig. 7.
Fig. 7.
ER–mitochondrial Ca2+ transfer drives the adaptive metabolic response. (A) Oxygen consumption rates were measured in HeLa cells treated for 4 hours with 0.5 μg/ml tunicamycin (Tun) in combination with 2 μM xestospongin B as indicated. (B) Oxygen consumption rates were measured in HeLa cells treated for 4 hours with 0.5 μg/ml tunicamycin in combination with 10 μM RuRed as indicated. (C) The quantification of dead cells (PI positive) and cells with a low ΔΨm [low DiOC6(3) staining] after 4 hours treatment with 1 μg/ml tunicamycin in combination with 10 μM RuRed was determined by flow cytometry. Data are means±s.e.m. *P<0.05; **P<0.01 compared with untreated controls; #P<0.05 compared with tunicamycin alone.

References

    1. Addabbo F., Ratliff B., Park H. C., Kuo M. C., Ungvari Z., Csiszar A., Krasnikov B., Sodhi K., Zhang F., Nasjletti A., et al. (2009). The Krebs cycle and mitochondrial mass are early victims of endothelial dysfunction: proteomic approach. Am. J. Pathol. 174, 34-43 - PMC - PubMed
    1. Bach D., Pich S., Soriano F. X., Vega N., Baumgartner B., Oriola J., Daugaard J. R., Lloberas J., Camps M., Zierath J. R., et al. (2003). Mitofusin-2 determines mitochondrial network architecture and mitochondrial metabolism. A novel regulatory mechanism altered in obesity. J. Biol. Chem. 278, 17190-17197 - PubMed
    1. Balaban R. S. (2009). The role of Ca2+ signaling in the coordination of mitochondrial ATP production with cardiac work. Biochim. Biophys. Acta 1787, 1334-1341 - PMC - PubMed
    1. Berridge M. J. (2002). The endoplasmic reticulum: a multifunctional signaling organelle. Cell Calcium 32, 235-249 - PubMed
    1. Boldogh I. R., Pon L. A. (2006). Interactions of mitochondria with the actin cytoskeleton. Biochim. Biophys. Acta 1763, 450-462 - PubMed

Publication types

MeSH terms