. 2011 Jul;21(7):1074-86.
doi: 10.1101/gr.118703.110. Epub 2011 May 31.

Cell type-specific DNA methylation at intragenic CpG islands in the immune system

Affiliations

Cell type-specific DNA methylation at intragenic CpG islands in the immune system

Aimée M Deaton et al. Genome Res. 2011 Jul.

Abstract

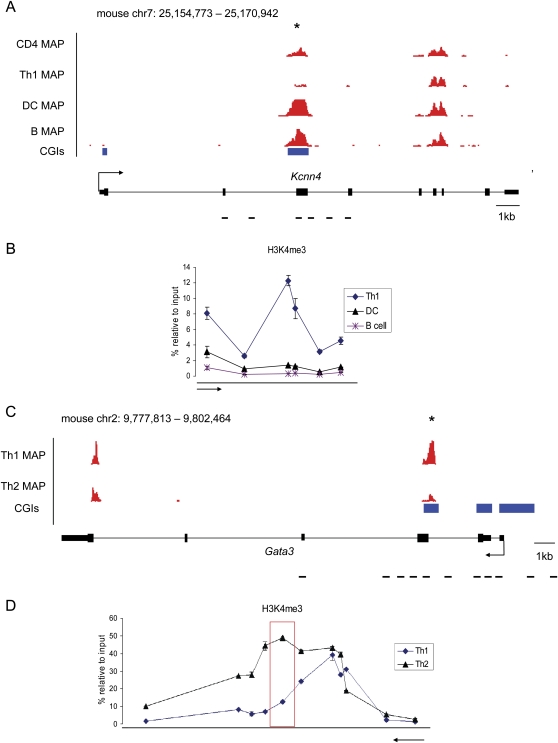
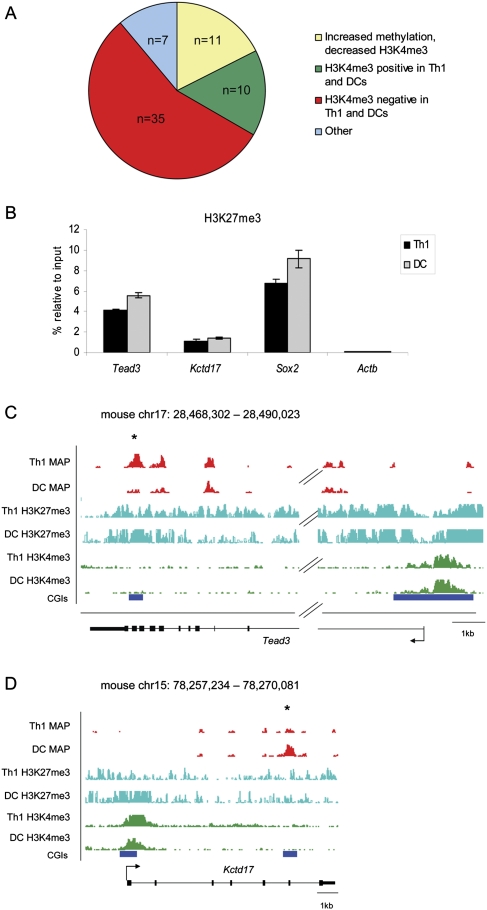
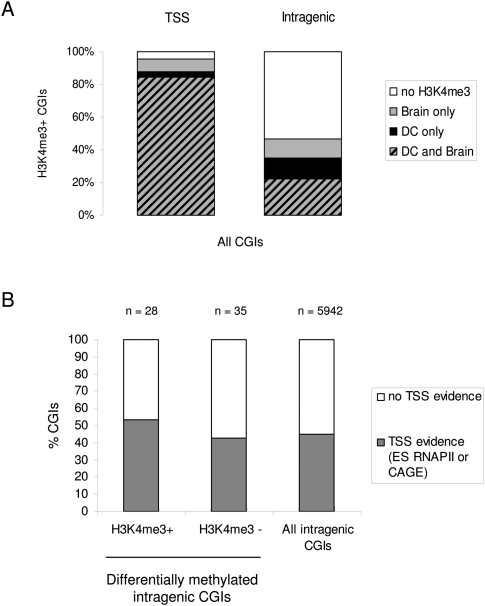
Human and mouse genomes contain a similar number of CpG islands (CGIs), which are discrete CpG-rich DNA sequences associated with transcription start sites. In both species, ∼50% of all CGIs are remote from annotated promoters but, nevertheless, often have promoter-like features. To determine the role of CGI methylation in cell differentiation, we analyzed DNA methylation at a comprehensive CGI set in cells of the mouse hematopoietic lineage. Using a method that potentially detects ∼33% of genomic CpGs in the methylated state, we found that large differences in gene expression were accompanied by surprisingly few DNA methylation changes. There were, however, many DNA methylation differences between hematopoietic cells and a distantly related tissue, brain. Altered DNA methylation in the immune system occurred predominantly at CGIs within gene bodies, which have the properties of cell type-restricted promoters, but infrequently at annotated gene promoters or CGI flanking sequences (CGI "shores"). Unexpectedly, elevated intragenic CGI methylation correlated with silencing of the associated gene. Differentially methylated intragenic CGIs tended to lack H3K4me3 and associate with a transcriptionally repressive environment regardless of methylation state. Our results indicate that DNA methylation changes play a relatively minor role in the late stages of differentiation and suggest that intragenic CGIs represent regulatory sites of differential gene expression during the early stages of lineage specification.


Figures

Figure 1.
Figure 1.
Cell type–specific methylation in the hematopoietic lineage detected by MAP-seq preferentially occurs at CGIs. (A) The immune cell lineage with the cell types investigated shown in red. HSC: hematopoietic stem cell. (B) The number of CGI methylation, non-CGI-associated methylation, and gene expression changes observed when CD4 T-cells were compared to Th2, Th1, B cells, dendritic cells (DC), and brain. (C,D) The location of methylation differences detected by MAP-seq. The fraction of the genome that can be interrogated by MAP-seq was categorized as overlapping a CGI (CGI), not overlapping but within 2 kb of a CGI (0–2 kb), or >2 kb from a CGI (>2 kb). The location of DNA methylation changes was then determined and expressed as the number of methylation changes occurring per kilobase (kb) of genome in each category. (C) Location of all DNA methylation changes occurring between different immune cells. (D) Location of DNA methylation changes occurring between brain and CD4 cells.
Figure 2.
Figure 2.
Cell type–specific methylation occurs at intragenic CGIs. (A) CGIs can be transcription start site (TSS)-associated, intragenic, or intergenic. (B) The distribution of CGIs in the mouse genome (Illingworth et al. 2010). (C) Pairwise comparisons of immune cell types [dendritic cells (DC), Th1 cells, Th2 cells, B cells, and CD4 T-cells] showing the location of methylation changes in each comparison. (D) The percentage of CGIs in each class showing a DNA methylation change in any of the immune cell comparisons. Each CGI was only counted once even if it changed in multiple comparisons.
Figure 3.
Figure 3.
Differential intragenic CGI methylation negatively correlates with gene expression. Genes showing both a change in DNA methylation at an intragenic CGI and a change in gene expression were plotted. (A) All immune cell comparisons where (+) denotes an increase and (-) denotes a decrease in expression or methylation. (B) The percentage of methylation changes showing a positive or negative correlation with gene expression in immune cells. (C) Brain compared with CD4 cells. (+) denotes an increase and (-) a decrease in expression or methylation. (D) The percentage of methylation changes between brain and CD4 cells showing a positive or negative correlation with gene expression. (E) Expression of Gata3 (relative to Eef1A1) in Th1 and Th2 cells verified by qRT-PCR. (F) MAP-seq read density profile (red) showing differential methylation at an intragenic CGI (asterisk) in the Gata3 gene. CGIs are shown in blue. The arrow indicates the origin and direction of transcription. (G) Confirmation of Gata3 methylation by bisulfite sequencing of in vitro differentiated Th1 and Th2 cells as well as Th2 cells isolated from a Schistosoma mansoni infection. The gray bar on the MAP-seq profile (panel F) indicates the region interrogated. (Filled circles) Methylated CpGs. (Empty circles) Unmethylated CpGs.
Figure 4.
Figure 4.
Decreased DNA methylation is associated with increased H3K4me3 at the Kcnn4 and Gata3 intragenic CGIs. (A) MAP-seq read density profile (red) showing a methylation difference between Th1 cells, dendritic cells (DC), and B cells at a CGI in Kcnn4 gene (asterisk). (B) ChIP combined with qPCR across the Kcnn4 locus reveals specific enrichment for H3K4me3 in Th1 cells where the intragenic CGI is hypomethylated. (C) The methylation difference between Th1 and Th2 cells at the Gata3 locus (asterisk) is associated with a difference in H3K4me3 specifically over the intragenic CGI (red box) (D). For both genes, the arrow indicates the origin and direction of transcription, blue indicates CGIs, and black lines indicate the position of PCR primer pairs.
Figure 5.
Figure 5.
Most differentially methylated intragenic CGIs are depleted for H3K4me3 in immune cells. (A) Association of intragenic CGIs differentially methylated in Th1 and dendritic cells with H3K4me3 as assessed by ChIP-seq. (Yellow) CGIs where increased DNA methylation is associated with decreased H3K4me3 (n = 11). (Green) CGIs that are positive for H3K4me3 in both cell types despite a difference in methylation (n = 10). (Red) CGIs that lack H3K4me3 in both cell types (n = 35). (Blue) CGIs showing a nonsignificant change in H3K4me3 (n = 5) or where increased DNA methylation is associated with increased H3K4me3 (n = 2). (B) ChIP-PCR reveals enrichment for H3K27me3 at Tead3 and Kctd17 in Th1 and dendritic cells (DC) as well as at Sox2 (positive control). The active Actb gene acted as a negative control. These results were confirmed and extended using H3K27me3 ChIP-seq. MAP-seq (red), H3K27me3 ChIP-seq (cyan), and H3K4me3 (green) read density profiles for intragenic CGIs in the (C) Tead3 and (D) Kctd17 genes that lack H3K4me3 in Th1 and dendritic cells, despite showing differential methylation between the two cell types (asterisked CGI).
Figure 6.
Figure 6.
Intragenic CGIs frequently show tissue-specific H3K4me3, and differentially methylated intragenic CGIs have evidence for promoter function. (A) The percentage of TSS and intragenic CGIs that are positive for H3K4me3 in brain (gray), dendritic cells (black), or both (stripes). (B) RNAPII binding data for ES cells and CAGE data for mouse tissues was used to infer whether intragenic CGIs have evidence for association with a TSS (see Methods). H3K4me3 positive and H3K4me3 negative differentially methylated intragenic CGIs are shown, along with all intragenic CGIs in the mouse genome.

References

    1. Allo M, Buggiano V, Fededa JP, Petrillo E, Schor I, de la Mata M, Agirre E, Plass M, Eyras E, Elela SA, et al. 2009. Control of alternative splicing through siRNA-mediated transcriptional gene silencing. Nat Struct Mol Biol 16: 717–724 - PubMed
    1. Antequera F, Boyes J, Bird A 1990. High levels of de novo methylation and altered chromatin structure at CpG islands in cell lines. Cell 62: 503–514 - PubMed
    1. Ball MP, Li JB, Gao Y, Lee JH, LeProust EM, Park IH, Xie B, Daley GQ, Church GM 2009. Targeted and genome-scale strategies reveal gene-body methylation signatures in human cells. Nat Biotechnol 27: 361–368 - PMC - PubMed
    1. Batsche E, Yaniv M, Muchardt C 2006. The human SWI/SNF subunit Brm is a regulator of alternative splicing. Nat Struct Mol Biol 13: 22–29 - PubMed
    1. Begenisich T, Nakamoto T, Ovitt CE, Nehrke K, Brugnara C, Alper SL, Melvin JE 2004. Physiological roles of the intermediate conductance, Ca2+-activated potassium channel Kcnn4. J Biol Chem 279: 47681–47687 - PubMed

Publication types

MeSH terms

Associated data