. 2011 Jul;21(7):1042-54.
doi: 10.1101/gr.116681.110. Epub 2011 May 31.

Pervasive haplotypic variation in the spliceo-transcriptome of the human major histocompatibility complex

Affiliations

Pervasive haplotypic variation in the spliceo-transcriptome of the human major histocompatibility complex

Claire Vandiedonck et al. Genome Res. 2011 Jul.

Abstract

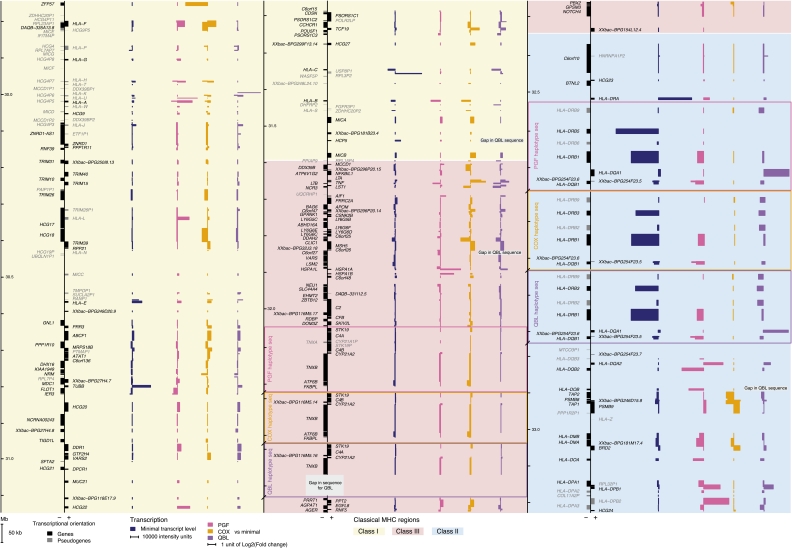
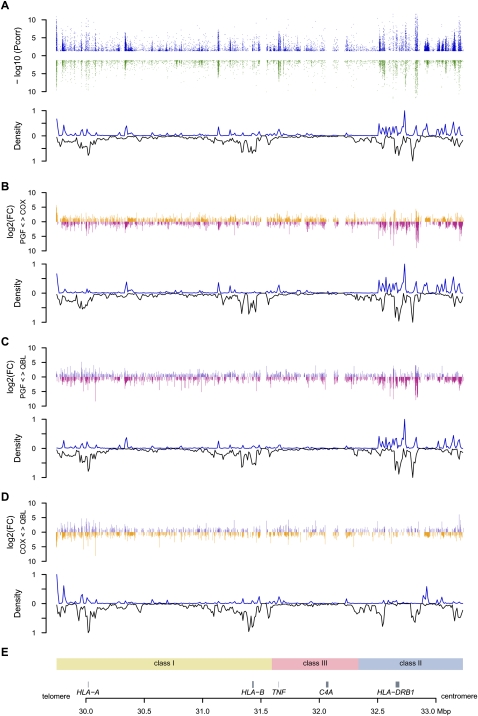
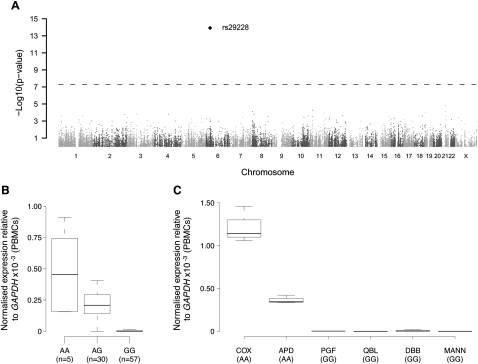
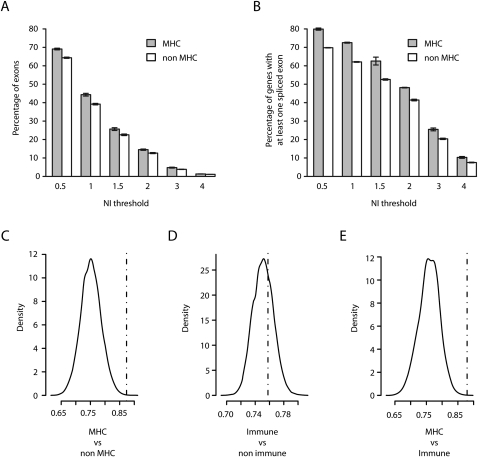
The human major histocompatibility complex (MHC) on chromosome 6p21 is a paradigm for genomics, showing remarkable polymorphism and striking association with immune and non-immune diseases. The complex genomic landscape of the MHC, notably strong linkage disequilibrium, has made resolving causal variants very challenging. A promising approach is to investigate gene expression levels considered as tractable intermediate phenotypes in mapping complex diseases. However, how transcription varies across the MHC, notably relative to specific haplotypes, remains unknown. Here, using an original hybrid tiling and splice junction microarray that includes alternate allele probes, we draw the first high-resolution strand-specific transcription map for three common MHC haplotypes (HLA-A1-B8-Cw7-DR3, HLA-A3-B7-Cw7-DR15, and HLA-A26-B18-Cw5-DR3-DQ2) strongly associated with autoimmune diseases including type 1 diabetes, systemic lupus erythematosus, and multiple sclerosis. We find that haplotype-specific differences in gene expression are common across the MHC, affecting 96 genes (46.4%), most significantly the zing finger protein gene ZFP57. Differentially expressed probes are correlated with polymorphisms between haplotypes, consistent with cis effects that we directly demonstrate for ZFP57 in a cohort of healthy volunteers (P = 1.2 × 10(-14)). We establish that alternative splicing is significantly more frequent in the MHC than genome-wide (72.5% vs. 62.1% of genes, P ≤ 1 × 10(-4)) and shows marked haplotypic differences. We also unmask novel and abundant intergenic transcription involving 31% of transcribed blocks identified. Our study reveals that the renowned MHC polymorphism also manifests as transcript diversity, and our novel haplotype-based approach marks a new step toward identification of regulatory variants involved in the control of MHC-associated phenotypes and diseases.


Figures

Figure 1.
Figure 1.
The first transcriptional map of the human MHC: Haplotype-specific pattern of expression. Each cell line transcription level against the minimal level of the three cell lines is displayed; (pink) PGF, (orange) COX, and (purple) QBL. Bars corresponding to genes on the minus strand are displayed leftward and those for the plus strand rightward. Boxes in the class III and class II regions indicate haplotype-specific segmental duplications. Overall, the MHC class II region presents the highest minimal expression (dark blue). The most differentially expressed gene is ZFP57, located at the beginning of the class I region.
Figure 2.
Figure 2.
Distribution of differentially expressed (DE) probes versus polymorphic SNPs. Only probes shared by the three haplotypes were included. (A) Three-haplotype comparison. (Upper panel) Significance level of DE probes for either unstimulated (blue) or stimulated (green) cells. The −log10 of significant adjusted P-values are plotted against the genomic coordinates. (Lower panel) Density curve of DE probes normalized using the number of probes designed (upward) mirroring the density curve of polymorphic SNPs between the three cell lines (downward) for 350 10-kb windows spanning the MHC. Densities have been normalized. (B–D) Pairwise comparisons of COX versus PGF, QBL versus PGF, and QBL versus COX. For each pair, the log2 of the intensity fold change (FC) is represented in the upper panel. For example, when expression is higher in COX than in PGF, the FC is set positive and an orange bar is represented above the x-axis. Conversely, when expression is higher in PGF, the FC is negative and represented by a pink bar below the x-axis. The density curves of DE probes and of SNPs polymorphic between both cells are plotted in the lower panel. (E) Genomic context.
Figure 3.
Figure 3.
Expression quantitative trait mapping for ZFP57. Expression of ZFP57 was determined by quantitative real-time RT-PCR in peripheral blood mononuclear cells of 93 healthy volunteers and analyzed for association using 45,237 SNPs enriched for immune and inflammatory genes. (A) Manhattan plot showing a highly significant association for an SNP, rs29228, 16.8 kb centromeric to ZFP57. The horizontal dashed line indicates the genome-wide threshold significance. The absence of other association with neighbor SNPs on chromosome 6 is not unexpected due to moderate SNP coverage in the region and low level of linkage disequilibrium. (B,C) Boxplots of ZFP57 gene expression relative to GAPDH depending on rs29228 genotype in 92 successfully genotyped individuals (Kruskal-Wallis test on genotypes, P = 6.7 × 10⁻¹¹) (B) or for MHC-homozygous lymphoblastoid cell lines (C).
Figure 4.
Figure 4.
Extent of alternative splicing in the MHC. Absolute values of exon level intensities normalized against gene intensities [NI = log2(exon/gene)] were computed from the median signal of the three PGF sample replicates hybridized to the Affymetrix Exon 1.0 ST array. Thus, absolute NI > 1 indicates that the exon is expressed at least twice more or less than the overall gene level. Mean percentage of exons (A) and of genes with at least one exon (B) with NI value(s) exceeding the indicated thresholds for MHC (gray bars) and non-MHC genes (white bars). Error bars depict standard errors of the means of the three replicates (C–E) Comparisons of the median NIs (dashed vertical line) in the 131 MHC genes (C,E) or in 733 non-MHC immune genes (D) having at least four annotated exons in Vega with the density distribution of median NIs obtained in 10,000 random sets of similar numbers of non-MHC (C), non-MHC non-immune (D), and non-MHC immune (E) genes.
Figure 5.
Figure 5.
Variation of splicing events in AIF1 between haplotypes. (A) Gene transcripts as they are annotated in Vega. (B) Barplots of all exon normalized intensities (NI) for each cell line. The color code for each exon is indicated in the transcript scheme underneath. (C) Barplots for the junction normalized intensities (JNI). Donor and acceptor exons are represented on each half of the junction with the same color code as in B. If the junction is shared between different transcripts, the corresponding site is depicted as a composite of all possible exons. (B,C) Asterisks above barplots indicate the level of significance, as listed in the caption, for differential expression between the three cell lines. For example, the isoform AIF1-002 tagged by the exon in orange is proportionally more represented in QBL and PGF than in COX. Conversely, the isoform AIF1-005 characterized by the junction between the brown and the red exons is better represented in COX than in PGF and QBL.

Comment in

References

    1. Ahmad T, Neville M, Marshall SE, Armuzzi A, Mulcahy-Hawes K, Crawshaw J, Sato H, Ling KL, Barnardo M, Goldthorpe S, et al. 2003. Haplotype-specific linkage disequilibrium patterns define the genetic topography of the human MHC. Hum Mol Genet 12: 647–656 - PubMed
    1. Barcellos LF, Oksenberg JR, Begovich AB, Martin ER, Schmidt S, Vittinghoff E, Goodin DS, Pelletier D, Lincoln RR, Bucher P, et al. 2003. HLA-DR2 dose effect on susceptibility to multiple sclerosis and influence on disease course. Am J Hum Genet 72: 710–716 - PMC - PubMed
    1. Bertone P, Stolc V, Royce TE, Rozowsky JS, Urban AE, Zhu X, Rinn JL, Tongprasit W, Samanta M, Weissman S, et al. 2004. Global identification of human transcribed sequences with genome tiling arrays. Science 306: 2242–2246 - PubMed
    1. Carosella ED, Favier B, Rouas-Freiss N, Moreau P, Lemaoult J 2008. Beyond the increasing complexity of the immunomodulatory HLA-G molecule. Blood 111: 4862–4870 - PubMed
    1. Cheung VG, Spielman RS 2009. Genetics of human gene expression: mapping DNA variants that influence gene expression. Nat Rev Genet 10: 595–604 - PMC - PubMed

Publication types

MeSH terms

Associated data