. 2011 Aug;79(8):3397-406.
doi: 10.1128/IAI.01080-10. Epub 2011 May 31.

Oral exposure to Trypanosoma cruzi elicits a systemic CD8⁺ T cell response and protection against heterotopic challenge

Affiliations

Oral exposure to Trypanosoma cruzi elicits a systemic CD8⁺ T cell response and protection against heterotopic challenge

Matthew H Collins et al. Infect Immun. 2011 Aug.

Abstract

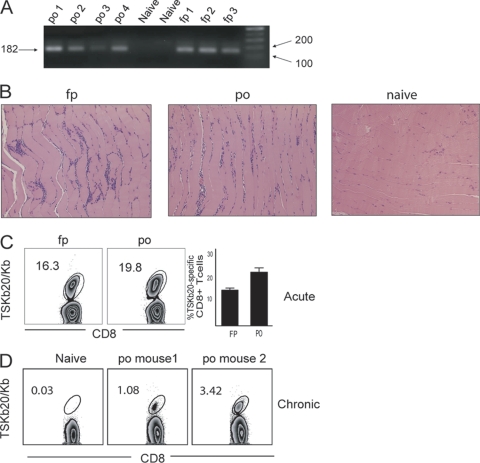
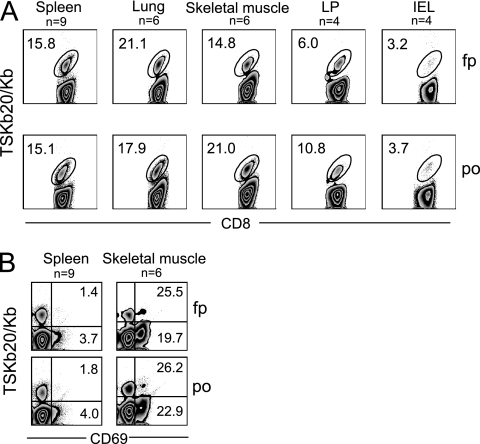
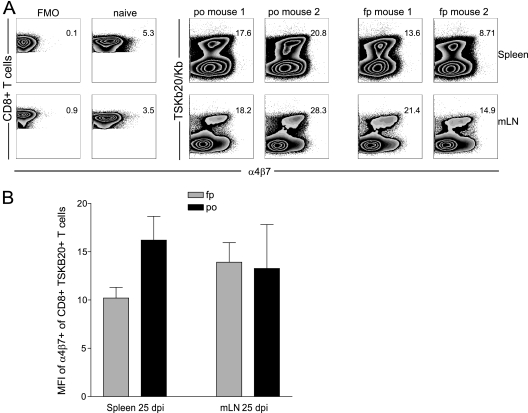
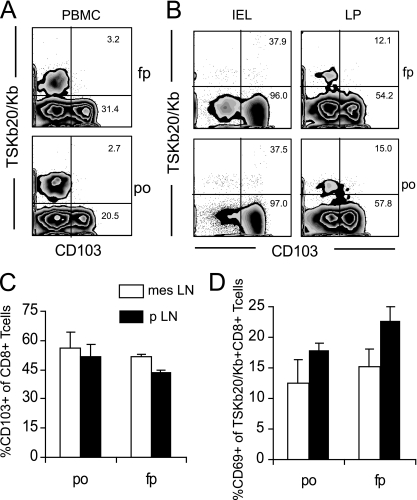
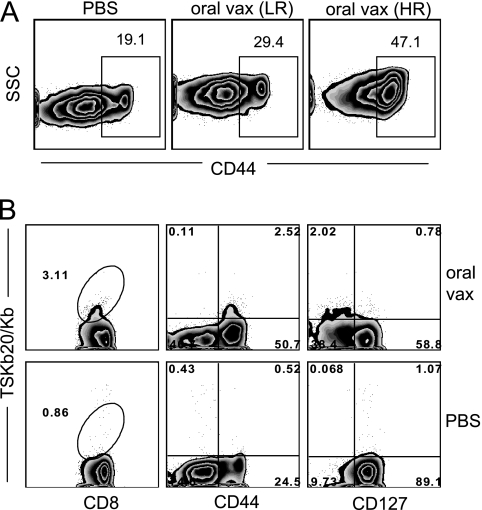
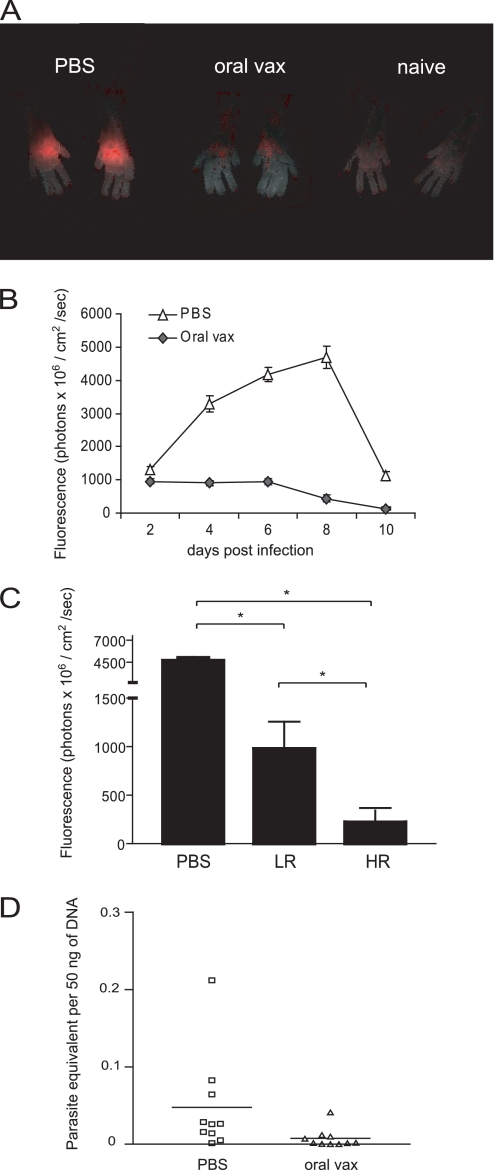
Trypanosoma cruzi infects millions of people in Latin America and often leads to the development of Chagas disease. T. cruzi infection can be acquired at or near the bite site of the triatomine vector, but per os infection is also a well-documented mode of transmission, as evidenced by recent microepidemics of acute Chagas disease attributed to the consumption of parasite-contaminated foods and liquids. It would also be convenient to deliver vaccines for T. cruzi by the oral route, particularly live parasite vaccines intended for the immunization of reservoir hosts. For these reasons, we were interested in better understanding immunity to T. cruzi following oral infection or oral vaccination, knowing that the route of infection and site of antigen encounter can have substantial effects on the ensuing immune response. Here, we show that the route of infection does not alter the ability of T. cruzi to establish infection in muscle tissue nor does it impair the generation of a robust CD8(+) T cell response. Importantly, oral vaccination with attenuated parasites provides protection against wild-type (WT) T. cruzi challenge. These results strongly support the development of whole-organism-based vaccines targeting reservoir species as a means to alleviate the burden of Chagas disease in affected regions.


Figures

Fig. 1.
Fig. 1.
Oral infection with metacyclic trypomastigotes of T. cruzi leads to systemic infection. (A) Metacyclic trypomastigotes delivered by either p.o. or f.p. route are detectable in skeletal muscle. DNA was extracted from skeletal muscle of mice 21 to 25 dpi, and a 182-bp segment of satellite DNA was amplified by PCR. n = 10 for f.p. and n = 7 for p.o. The sizes of the PCR product and markers are shown (in base pairs) at the left and right, respectively. (B) Similar inflammatory infiltrates develop in skeletal muscle of mice infected by f.p. and p.o. H&E sections of skeletal muscle are shown for naïve and p.o. and f.p.-infected mice at 35 dpi and are representative of at least 3 more experiments that ended between 21 and 40 dpi. (C and D) T. cruzi infection via the oral route induces a robust and lasting systemic T cell response. Representative flow plots show the frequency of CD8+ T cells specific for TSKb20 in PBMC at 14 dpi (n = 10 for p.o. and n = 5 for f.p. [C]), and the means ± standard error of the mean (SEM) are displayed. (D) TSKb20-specific CD8+ T cells were measured in spleens of two individual mice infected p.o. at 140 dpi.
Fig. 2.
Fig. 2.
T. cruzi-specific CD8+ T cells traffic to peripheral tissues and are activated in sites of parasite persistence independently of infection route. (A) Flow plots show the frequency of TSKb20-specific CD8+ cells in the indicated tissue of f.p.- or p.o. infected mice during acute T. cruzi infection. (B) Recently activated T. cruzi-specific CD8+ T cells are present in sites of persistence. Flow plots are gated on CD8+ T cells isolated from spleen or skeletal muscle of f.p.- or p.o. infected mice and show CD69 expression on TSKb20-specific cells. Numbers indicate the frequency of TSKb20+ CD8+ (top right) or TSKb20 CD8+ (bottom right) T cells expressing CD69. Numbers in flow plots are the average frequency obtained from mice sacrificed between 19 and 39 dpi. The number of data points (n) is shown for each group; some data points comprise cells isolated from the pooled tissue of two or three mice harvested on the same day.
Fig. 3.
Fig. 3.
Oral infection route does not skew T. cruzi-specific CD8+ T cells toward a gut homing phenotype. Lymphocytes were isolated from spleen (top) and mLN (bottom) of T. cruzi-infected mice at 25 dpi and naïve age-matched mice, and surface expression of α4β7 was assessed by flow cytometry. (A) Fluorescence minus one (FMO) and naïve CD8+ T staining controls for α4β7 expression are shown (left). Expression of α4β7 among TSKb20-specific CD8+ T cells is shown for 2 representative mice from a total of 5 mice (right). Flow plots are gated on CD8+ T cells. Numbers indicate the median fluorescence intensity (MFI) of CD8+ T cells for FMO and naïve samples and the MFI of TSKB20+ CD8+ T cells for the orally or footpad-infected mice. (B) Mean ± SEM of MFI for α4β7 expression on TSKB20+ CD8+ T cells. n = 5 mice per group.
Fig. 4.
Fig. 4.
Route of infection does not affect the distribution of TSKb20+ CD103+ CD8+ T cells or activation of TSKb20+ CD8+ T cells in gut-draining LN. (A) Gut-imprinted CD8+ T cells specific for T. cruzi are not detectable in blood early in infection. PBMC from mice at 14 dpi were isolated, and CD103 expression among TSKb20-specific cells was assessed by flow cytometry. Numbers in flow plots indicate the average percentage of TSKb20+ CD8+ (top) or TSKb20 CD8+ (bottom) T cells that express CD103 (f.p., n = 5; p.o., n = 10). (B) CD103 is expressed by gut CD8+ T cells, but by few T. cruzi-specific CD8+ T cells. IEL and LP lymphocytes were isolated from T. cruzi-infected mice between 19 and 39 dpi, and surface expression of CD103 was assessed by flow cytometry. Flow plots are gated on CD8+ T cells. Numbers indicate the average percentage of TSKb20+ CD8+ (top) or TSKb20 CD8+ (bottom) CD8+ T cells that express CD103, from 4 similar experiments. (C) Flow cytometry was used to assess the proportion of all CD8+ T cells expressing CD103 in pLN and mesLN of mice after f.p. and p.o. infection with T. cruzi. Bars show average percentage of CD103+ CD8+ cells ± SEM. (D) The proportion of recently activated TSKb20+ CD8+ T cells in different lymph nodes was assessed by flow cytometry. Bars show average percentage of CD103+ CD8+ cells ± SEM. n = 3 mice per group. Similar data were obtained in a replicate experiment.
Fig. 5.
Fig. 5.
Oral vaccination (vax) with attenuated parasites stimulates T. cruzi-specific CD8+ T cells. (A) Variable degrees of T cell stimulation result from oral vaccination. CD44 expression was assessed 2 weeks after final vaccination on CD8+ T cells in PBMC. Of 10 vaccinated mice, 3 were designated LR and 7 were designated HR. Flow plots are gated on CD8+ T cells, and numbers and gates indicate the average percentage of CD44hi cells in each group. (B) Oral vaccination generates activated T. cruzi-specific CD8+ T cells. Flow plots are from an individual mouse chosen from HR group to screen for TSKb20+ responses and CD127 downregulation. All plots are gated on CD8+ T cells, and numbers indicate the percentage of CD8+ T cells in a gate or quadrant.
Fig. 6.
Fig. 6.
Oral vaccination with attenuated parasites protects mice from WT T. cruzi challenge. (A) Parasites are immediately controlled at infection site. Vaccinated mice (n = 10) and control mice (n = 10) were challenged with 2.5 × 10³ WT fluorescent T. cruzi trypomastigotes injected in superficial subcutaneous tissue of each footpad. Parasite load in f.p. was assessed by quantitating the fluorescent signal with an in vivo imaging system. Pictures show left and right feet of individual mice representative of the indicated group at 8 days postchallenge. (B) Vaccine protection is evident at all times through the first 10 days of T. cruzi infection. Graph shows the fluorescent signal of all feet in each group at indicated time points (average ± SEM, P < 0.05 at all time points, n = 20 feet [10 mice]). (C) Extent of T cell activation is predictive of vaccine efficacy. Parasite load at 8 dpc is graphed for the 4 mice with the highest percentage of CD44hi CD8+ T cells (HR), and the 2 mice with the lowest percentage of CD44hi CD8+ T cells (LR) are graphed along with all mice from PBS group (average ± SEM, * indicates P < 0.0001 by ANOVA). (D) Oral vaccine mice have lower parasite burden in skeletal muscle following WT T. cruzi challenge. Parasite load was measured in DNA samples extracted from skeletal muscle of oral vaccine (both HR and LR) and control mice 25 dpc by real-time PCR. Bars show mean of group.

References

    1. Amino R., et al. 2006. Quantitative imaging of Plasmodium transmission from mosquito to mammal. Nat. Med. 12:220–224 - PubMed
    1. Atwood J. A., III, et al. 2005. The Trypanosoma cruzi proteome. Science 309:473–476 - PubMed
    1. Bell L. V., Else K. J. 2008. Mechanisms of leucocyte recruitment to the inflamed large intestine: redundancy in integrin and addressin usage. Parasite Immunol. 30:163–170 - PubMed
    1. Belyakov I. M., Ahlers J. D. 2009. Comment on “trafficking of antigen-specific CD8+ T lymphocytes to mucosal surfaces following intramuscular vaccination.” J. Immunol. 182:1779–1780 - PubMed
    1. Belyakov I. M., et al. 1998. The importance of local mucosal HIV-specific CD8(+) cytotoxic T lymphocytes for resistance to mucosal viral transmission in mice and enhancement of resistance by local administration of IL-12. J. Clin. Invest. 102:2072–2081 - PMC - PubMed

Publication types

MeSH terms