. 2011 Jun 14;108(24):9899-904.
doi: 10.1073/pnas.1019576108. Epub 2011 May 31.

Benchmark map of forest carbon stocks in tropical regions across three continents

Affiliations

Benchmark map of forest carbon stocks in tropical regions across three continents

Sassan S Saatchi et al. Proc Natl Acad Sci U S A. .

Abstract

Developing countries are required to produce robust estimates of forest carbon stocks for successful implementation of climate change mitigation policies related to reducing emissions from deforestation and degradation (REDD). Here we present a "benchmark" map of biomass carbon stocks over 2.5 billion ha of forests on three continents, encompassing all tropical forests, for the early 2000s, which will be invaluable for REDD assessments at both project and national scales. We mapped the total carbon stock in live biomass (above- and belowground), using a combination of data from 4,079 in situ inventory plots and satellite light detection and ranging (Lidar) samples of forest structure to estimate carbon storage, plus optical and microwave imagery (1-km resolution) to extrapolate over the landscape. The total biomass carbon stock of forests in the study region is estimated to be 247 Gt C, with 193 Gt C stored aboveground and 54 Gt C stored belowground in roots. Forests in Latin America, sub-Saharan Africa, and Southeast Asia accounted for 49%, 25%, and 26% of the total stock, respectively. By analyzing the errors propagated through the estimation process, uncertainty at the pixel level (100 ha) ranged from ± 6% to ± 53%, but was constrained at the typical project (10,000 ha) and national (>1,000,000 ha) scales at ca. ± 5% and ca. ± 1%, respectively. The benchmark map illustrates regional patterns and provides methodologically comparable estimates of carbon stocks for 75 developing countries where previous assessments were either poor or incomplete.


Conflict of interest statement

The authors declare no conflict of interest.

Figures

Fig. 1.
Fig. 1.
Allometric relations between Lorey's height and aboveground biomass of calibration plots at spatial scales comparable to GLAS footprints. (A) Combined relation from three continents (AGB = 0.3104H2.0608, R2 = 0.85, P < 0.001). (B–D) Allometric relation (B) from 298 plots in Latin America (AGB = 0.4574H1.9701, R2 = 0.89, P < 0.001), (C) from 75 plots in sub-Saharan Africa including woodland savanna (AGB = 0.3542H2.0528, R2 = 0.85, P < 0.001), and (D) from 120 plots in Southeast Asia including plots in secondary and fragmented forests (AGB = 0.0508H2.5213, R2 = 0.79, P < 0.001).
Fig. 2.
Fig. 2.
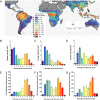
Distribution of forest aboveground biomass (circa 2000). (A) Forest aboveground biomass is mapped at 1-km spatial resolution. The study region was bounded at 30° north latitude and 40° south latitude to cover forests of Latin America and sub-Saharan Africa and from 60° to 155° east and west longitude. The map was colored on the basis of 25–50 Mg ha−1 AGB classes to better show the overall spatial patterns of forest biomass in tropical regions. Histogram distributions of forest area (at 10% tree cover) for each biomass class were calculated by summing the pixels over Latin America in B, Africa in C, and Asia in D. Similarly, total AGB for each class was computed by summing the values in each region with distributions provided for Latin America in E, Africa in F, and Asia in G. All error bars were computed by using the prediction errors (SI Materials and Methods) from spatial modeling.
Fig. 3.
Fig. 3.
Benchmark map of carbon stock and uncertainty. (A) Forest carbon stock defined as 50% of AGB + BGB is mapped at 1-km pixel resolution and colored on the basis of a 12–25 Mg C ha−1 range to show the spatial patterns. (B) The uncertainty of the benchmark map is estimated using error propagation through a spatial modeling approach. The uncertainty is given in terms of plus or minus percent and it includes all errors associated with prediction from spatial modeling, estimation of Lorey's height from GLAS, estimation of AGB from Lorey's height, errors from pixel level variations, and errors associated with BGB estimation (SI Materials and Methods).
Fig. 4.
Fig. 4.
Total carbon stock across the study region at three thresholds of canopy cover. Distribution of total (above- and belowground) biomass carbon stocks is shown. Carbon was computed by using the pixel-based AGB values to estimate root biomass and summing values across thresholds of percentage of tree cover (10%, 25%, and 30%) obtained from intersecting the 2001 MODIS vegetation continuous field (VCF) product (SI Materials and Methods) with the benchmark map. Similar distributions for each continent were produced separately. The error bars are based on the difference between the upper and lower limits of predicted AGB for computing total carbon (Table S2).

References

    1. Denman KL, et al. In: IPCC Climate Change 2007: The Physical Science Basis. Solomon S, et al., editors. Cambridge Univ Press; 2007. pp. 499–587.
    1. Schrope M. When money grows on trees. Nat Rep Climate Change. 2009;3:101–103.
    1. Van der Werf GR, et al. CO2 emissions from forest loss. Nat Geosci. 2009;2:737–738.
    1. Dixon RK, et al. Carbon pools and flux of global forest ecosystems. Science. 1994;263:185–190. - PubMed
    1. Chave J, et al. Assessing evidence for a pervasive alteration in tropical tree communities. PLoS Biol. 2008;6:e45. - PMC - PubMed

Publication types

LinkOut - more resources