. 2011 Jun 14;108(24):9770-5.
doi: 10.1073/pnas.1102409108. Epub 2011 May 31.

Enhanced chemistry-climate feedbacks in past greenhouse worlds

Affiliations

Enhanced chemistry-climate feedbacks in past greenhouse worlds

David J Beerling et al. Proc Natl Acad Sci U S A. .

Abstract

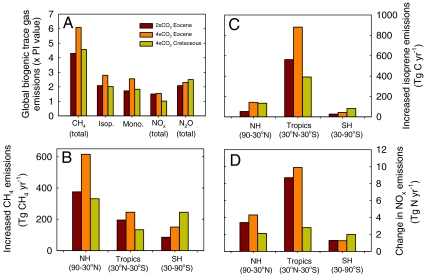
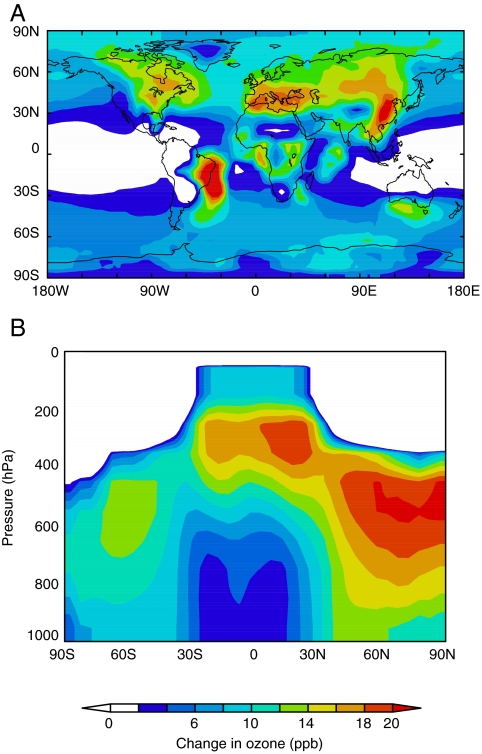
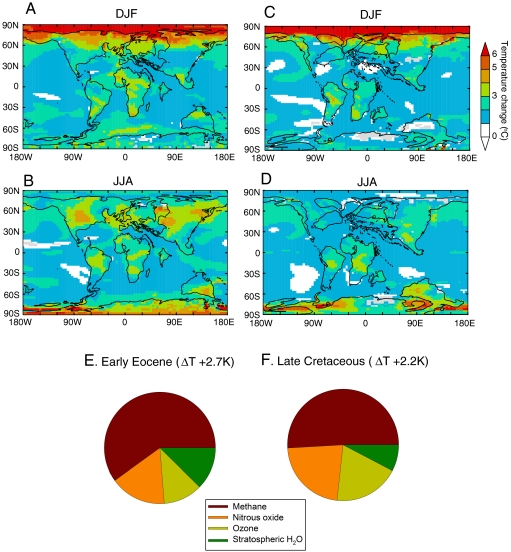
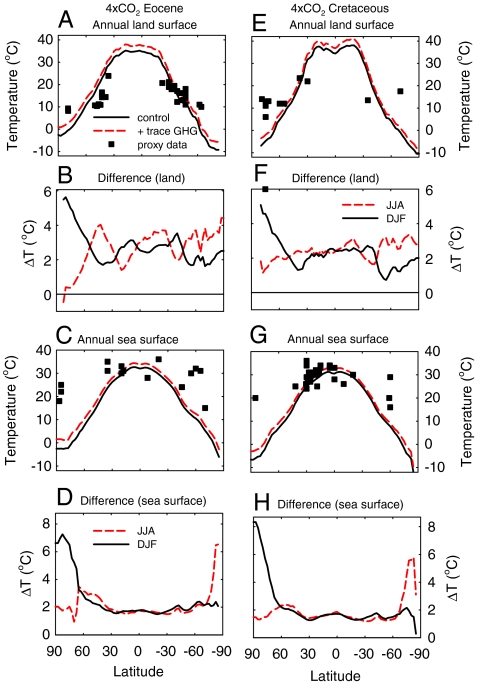
Trace greenhouse gases are a fundamentally important component of Earth's global climate system sensitive to global change. However, their concentration in the pre-Pleistocene atmosphere during past warm greenhouse climates is highly uncertain because we lack suitable geochemical or biological proxies. This long-standing issue hinders assessment of their contribution to past global warmth and the equilibrium climate sensitivity of the Earth system (E(ss)) to CO(2). Here we report results from a series of three-dimensional Earth system modeling simulations indicating that the greenhouse worlds of the early Eocene (55 Ma) and late Cretaceous (90 Ma) maintained high concentrations of methane, tropospheric ozone, and nitrous oxide. Modeled methane concentrations were four- to fivefold higher than the preindustrial value typically adopted in modeling investigations of these intervals, even after accounting for the possible high CO(2)-suppression of biogenic isoprene emissions on hydroxyl radical abundance. Higher concentrations of trace greenhouse gases exerted marked planetary heating (> 2 K), amplified in the high latitudes (> 6 K) by lower surface albedo feedbacks, and increased E(ss) in the Eocene by 1 K. Our analyses indicate the requirement for including non-CO(2) greenhouse gases in model-based E(ss) estimates for comparison with empirical paleoclimate assessments, and point to chemistry-climate feedbacks as possible amplifiers of climate sensitivity in the Anthropocene.


Conflict of interest statement

The authors declare no conflict of interest.

Figures

Fig. 1.
Fig. 1.
Terrestrial ecosystem emissions of reactive trace gases in the Eocene and Cretaceous. Simulated equilibrium global-scale (A) reactive biogenic trace gas emissions to the atmosphere for the 2 × CO2 (560 ppm) and 4 × CO2 (1,120 ppm) Eocene, and 4 × CO2 Cretaceous climates, relative to the preindustrial (PI) era. Panels B, C, and D, respectively, show zonal total fluxes for methane (CH4) from all biogenic sources (wetlands, biomass burning, oceans, and termites), isoprene released from forested regions, and oxides of nitrogen (NOx = NO + NO2) released from soils, and generated by biomass burning and lightning (see SI Text, SI Methods).
Fig. 2.
Fig. 2.
Elevated surface ozone concentrations in the Eocene compared to the preindustrial world. Simulated increases in (A) mean annual surface level ozone for the 4 × CO2 Eocene simulation and (B) the cross-sectional zonal average profile through the atmosphere. Ozone increases in (A) and (B) are relative to the preindustrial control simulation. Note in (A) changes in ozone fields are plotted over the present-day continental geography.
Fig. 3.
Fig. 3.
Enhanced chemistry-climate feedbacks in past greenhouse worlds. Simulated equilibrium surface temperature increases (ΔT) by elevated trace greenhouse gas concentrations (Table 1) on the 4 × CO2 Eocene (A, B) and 4 × CO2 Cretaceous (C, D) during northern hemisphere winter (DJF) and northern hemisphere summer [June July August (JJA)] climates respectively. Feedbacks were quantified with the coupled ocean-atmosphere GCM HadCM3L by prescribing PI and elevated levels of trace GHGs (Table 1). Only temperature differences exceeding 95% confidence limits are displayed. (E) and (F) indicate the relative contribution of each greenhouse gas to land surface mean annual temperature increases in the Eocene and Cretaceous respectively.
Fig. 4.
Fig. 4.
Simulated latitudinal temperature gradients in the Eocene and Cretaceous. (A) Latitudinally averaged mean annual land surface temperature in the Eocene (4 × CO2 concentration) for the control runs (preindustrial concentrations of trace greenhouse gases, black line) and after inclusion of the positive feedback of elevated trace greenhouse gases (red line). (B) Changes in latitudinally averaged seasonal mean annual land surface temperature due to forcing by elevated trace greenhouse gas concentrations relative to the control simulation. JJA; June, July, August; DJF; December, January, February. (C) and (D) as (A) and (B) but for sea-surface temperature. (EH) Equivalent plots as for AD, but for the 4 × CO2 Cretaceous simulations. Proxy data sources for panels A, C, E and G are given in SI Text.

References

    1. Lacis AA, Schmidt GA, Rind D, Rudy RA. Atmospheric CO2: principal control knob governing Earth’s temperature. Science. 2010;330:356–459. - PubMed
    1. Forster P, et al. Climate Change 2007: The Physical Science Basis. Cambridge: Cambridge University Press; 2007. pp. 129–234.
    1. Spahni R, et al. Atmospheric methane and nitrous oxide of the late Pleistocene from Antarctic ice cores. Science. 2005;310:1317–1321. - PubMed
    1. Flückiger J, et al. N2O and CH4 variations during the last glacial epoch: Insight into global processes. Global Biogeochem Cy. 2004;18:GB1020. 10.1029/2003GB002122.
    1. Zachos JC, Dickens GR, Zeebe RE. An early Cenozoic perspective on greenhouse warming and carbon-cycle dynamics. Nature. 2008;451:279–283. - PubMed

LinkOut - more resources