. 2011 Sep;19(9):1714-26.
doi: 10.1038/mt.2011.100. Epub 2011 May 31.

Neural stem cell-based cell carriers enhance therapeutic efficacy of an oncolytic adenovirus in an orthotopic mouse model of human glioblastoma

Affiliations

Neural stem cell-based cell carriers enhance therapeutic efficacy of an oncolytic adenovirus in an orthotopic mouse model of human glioblastoma

Atique U Ahmed et al. Mol Ther. 2011 Sep.

Abstract

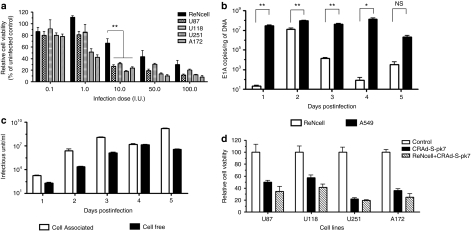
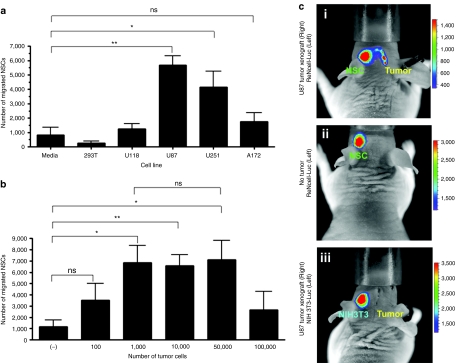
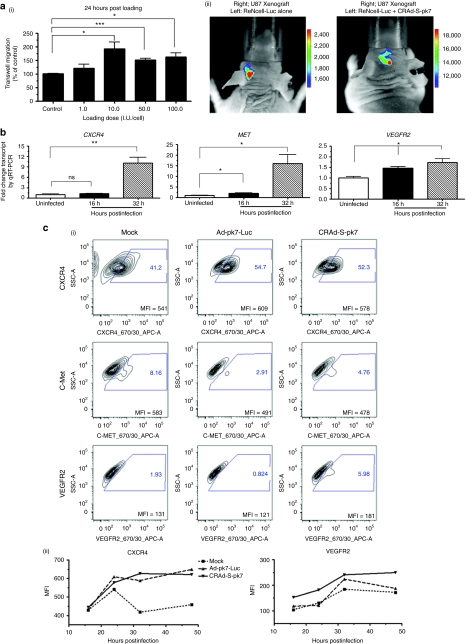
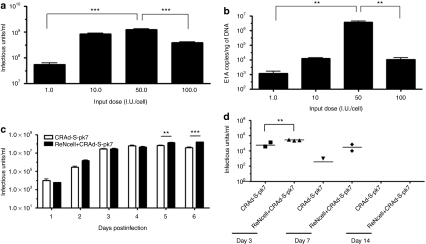
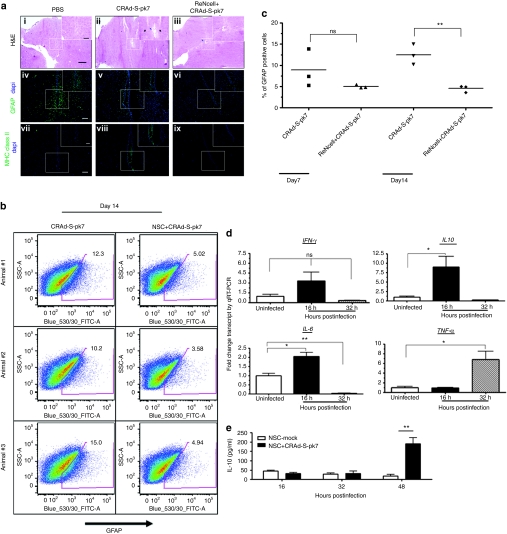
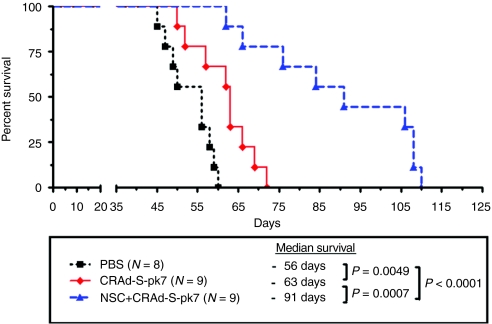
The potential utility of oncolytic adenoviruses as anticancer agents is significantly hampered by the inability of the currently available viral vectors to effectively target micrometastatic tumor burden. Neural stem cells (NSCs) have the ability to function as cell carriers for targeted delivery of an oncolytic adenovirus because of their inherent tumor-tropic migratory ability. We have previously reported that in vivo delivery of CRAd-S-pk7, a glioma-restricted oncolytic adenovirus, can enhance the survival of animals with experimental glioma. In this study, we show that intratumoral delivery of NSCs loaded with the CRAD-S-pk7 in an orthotopic xenograft model of human glioma is able to not only inhibit tumor growth but more importantly to increase median survival by ~50% versus animals treated with CRAd-S-pk7 alone (P = 0.0007). We also report that oncolytic virus infection upregulates different chemoattractant receptors and significantly enhances migratory capacity of NSCs both in vitro and in vivo. Our data further suggest that NSC-based carriers have the potential to improve the clinical efficacy of antiglioma virotherapy by not only protecting therapeutic virus from the host immune system, but also amplifying the therapeutic payload selectively at tumor sites.


Figures

Figure 1
Figure 1
CRAd-S-pk7 efficiently replicates in neural stem cells. (a) Cytopathic effects of oncolytic adenovirus on neural stem cells (NSCs) and a panel of human glioma cell lines. Cells were infected with different I.U. of CRAd-S-pk7 and cell viability was evaluated by trypan blue exclusion method at 48 hours postinfection. All conditions were conducted in triplicate and repeated in three separate experiments (error bars represent SD). All the glioma cell lines tested were highly susceptible to CRAd-S-pk7 virus killing, whereas NSCs were less susceptible (**P < 0.005 with 10 I.U. infection dose). (b) The replicative capacity of CRAd-S-pk7 was measured by quantitative RT-PCR. The extent of viral replication was determined by measuring the number of viral E1A copies per ng of DNA from the infected cells (error bars are SD). (c) Media and the cell plates were separated from the infected well. The total viral progeny in the cell plate (cell associated) and the progeny released by the infected NSCs (cell free) over time were measured by the titer assay. (d) Cytopathic effects of CRAd-S-pk7 virus released from loaded NSCs in a panel of human glioma cell lines. NSCs were loaded with the CRAd-S-pk7 virus at 50 I.U./cell for 2 hours and then washed and plated in the upper well of a transwell plate (5 × 10³ cells/well). Equal amounts of naked CRAd-S-pk7 (2.5 × 10⁵ I.U.) were also placed in the upper well. Four human glioma cell lines were placed in the bottom wells (5 × 10⁴ cells/well) and incubated for 6 days, after which cell viability was evaluated by trypan blue exclusion method. CRAd-S-pk7 virus released from the loaded NSCs was able to kill the glioma cells in the bottom wells as efficiently as the naked virus. All conditions were conducted in triplicate and repeated in two separate experiments (error bars are SD).
Figure 2
Figure 2
Tropism of neural stem cells (NSCs) for human malignant glioma cells in vitro and in vivo. NSC migration in response to different glioma cell lines was evaluated in Transwell migration chamber assay. (a) Quantitative measurement of the migrated NSCs in response to a panel of human glioma cell lines. U87 and U251 cells significantly stimulated NSC migration through transwell chambers after a 24-hour incubation (P < 0.005 for U87 cell and P < 0.05 for U251 cells compared to media alone). (b) Number of migrated NSCs in response to different amount of U87 cells. A total of 1,000 U87 cells was the minimum dose able to induce transwell migration of NSC (P < 0.05 for 1,000 U87 cells compared to media alone). (c) In vivo tumor-tropic migration of ReNcell. Bioluminescent imaging of mice after intracranial injection of ReNcell-Fluc into the left hemisphere of the mice implanted with U87 xenograft tumors on the right side 7 days (i) before or (ii) mice with no tumor. Another group of tumor-bearing mice received control fibroblast NIH-3T3-Rluc cell. Each group had five animals; photographs show a representative animal from each group. Imaging was done 24 hours postimplantation of the NSCs.
Figure 3
Figure 3
Oncolytic virus loading into neural stem cells (NSCs) augments their tumor-tropic migration in vitro. (a-i) Tumor-tropic migration of CRAd-S-pk7 loaded NSCs in response to U87 cells 24 hours after coculture in the transwell plate. All conditions were conducted in quadruplicate and repeated in two separate experiments. CRAd-S-pk7 significantly enhanced the in vitro tumor-tropic migration of NSCs. (a-ii) In vivo tumor-tropic migration of ReNcell after loading with CRAd-S-pk7 [50 infectious unit (I.U.)/cell]. Bioluminescent imaging of mice after intracranial injection of ReNcell-Fluc with (right) or without (left) CRAd-S-pk7 into the left hemisphere of the mice previously implanted with U87 xenograft tumors. Each group had five animals and a representative photograph is shown from each group. Imaging was done 8 hours postimplantation of the NSCs. (b) Analysis of expression of chemoattractant receptors c-MET, CXCR4, and VEGFR2 expression postloading with 50 I.U. of CRAd-S-pk7 virus per NSCs by quantitative RT-PCR (qRT-PCR); *P < 0.05, **P < 0.005 versus uninfected control. (c) Fluorescence-activated cell-sorting (FACS) analysis indicating that loading oncolytic adenovirus into ReNcell upregulates CXCR4 and VEGFR2 expression. ReNcell were infected with 50 I.U./cell of oncolytic adenovirus CRAd-S-pk7 (right column) or replication-incompetent Ad-pk7-Luc (middle column) and FACS analysis was performed at 16, 24, 32, and 48 hours postinfection. Cells were gated on isotype control and analyzed for CXCR4, c-Met, and VEGFR2 expression. (i) Representative contour plot profiles of chemoattractant receptor expression after 24-hour infection with the different viruses. The mean fluorescence intensity (MFI) of the total population is indicated in the contour plots (a representative experiments is shown; n = 4). (ii) CXCR4 and VEGFR2 receptor expression kinetics in the ReNcells after infection with different adenovirus expressed as MFI at 16, 24, 32, and 48 hours postinfection. A representative experiment of the four is shown. (d) Adenovirus infection/loading-induced enhancement of migratory capacity of ReNcell is blocked by function-inhibiting antibodies. ReNcells were incubated with CRAd-S-pk7 (50 I.U./cell) for 1 hour and preincubated with CXCR4 and VEGFR2 receptor function-inhibiting antibodies or isotype-matched control (IgG-CXCR4 and IgG-VEGFR2) antibodies for 1 hour, and then the cells were allowed to migrate to U87 cells in the transwell plate assay as described in the method section; experiment was done in triplicate, bars, SD. ***P < 0.0001. Similar data were obtained in three independent experiments.
Figure 4
Figure 4
Neural stem cells (NSCs) can act as in situ virus factories and maintain high doses of therapeutic virus in vivo. (a) U87 cells at the bottom wells from the Transwell migration experiments were collected at 72 hours along with the media and the CRAd-S-pk7 virus titer was measured. NSCs loaded with 50 infectious units (I.U.) of CRAd-S-pk7 per NSC were able to hand off maximum amount of therapeutic virus to the target tumor cells (error bars are SD; P < 0.0005 at loading dose of 50 I.U.), but the virus titer decreased when NSCs were loaded with 100 I.U. of CRAd-S-pk7 virus per cell (P < 0.0005 compared to loading dose of 50 I.U.). (b) The replicative capacity of CRAd-S-pk7 virus measured by quantitative RT-PCR in the targeted U87 cells. The extent of viral replication was determined by measuring the number of viral E1A copies per ng of DNA (error bars are SD). At the loading dose of 50 I.U. per NSC, the carrier cells were able to deliver the maximum amount of oncolytic virus to the target tumor cells as shown by the E1A copy number/ ng of DNA (P < 0.005 compared to loading dose 1.0 I.U./NSC). (c) This experiment was performed as described in the previous experiments (Figure 1b) but only using the U87 cells line. U87 cells at the bottom wells were collected every day along with the media for 6 days and the titer of CRAd-S-pk7 was measured. At day 5 and 6, the NSCs loaded with CRAd-S-pk7 virus were able to sustain a high titer of therapeutic virus in the target U87 cells (error bars are SD; P < 0.005 at day 5 and P < 0.0005 at day 6 compared to virus alone). (d) In vivo evidence that NSCs loaded with CRAd-S-pk7 virus can sustain high level of therapeutic virus titer. Mice were implanted with 2.5 × 10⁵ U87 cells in the right frontal lobe and the tumors were allowed to grow for 7 days. CRAd-S-pk7-loaded NSCs (5 × 10⁵ cells loaded with 50 I.U. of CRAd-S-pk7/NSC or equal amount of naked virus) were then injected intratumorally. Mice were killed at indicated time points, tumor from each animal was harvested and measured for virus titer (n = 3; student t-test, P < 0.005 at day 3).
Figure 5
Figure 5
Inhibitory effects of neural stem cells (NSCs) on adenovirus-induced neuroinflammation. (a) Evidence of brain damage in the injection sites. Histological features of brains from mice injected with CRAd-S-pk7 virus alone (2.5 × 10⁷ I.U./ injection) or virus loaded into NSCs (5 × 10⁵ cells loaded with 50 I.U. of CRAd-S-pk7 per NSCs) harvested at day 7 and 14 postinjection. (i–iii) Low-magnification image of hematoxylin–eosin (H&E) staining assessing neuronal toxicity postinjection. Bars = 80 µm. In box, high-magnification microphotograph show neuronal loss (blue arrow) and immune infiltrates (black arrow) at the site of injection. Bars = 40 µm. Representative image of sections of the same animal brain as H&E sections stained with anti-glial fibrillary acidic protein (GFAP) (iv–vi) and anti-mouse MHC class II antibody (vi–ix). Bars = 100 µm. (b) Brains from mice injected with CRAd-S-pk7 virus alone (2.5 × 10⁷ I.U./injection) or virus loaded into NSCs (5 × 10⁵ cells loaded with 50 I.U. of CRAd-S-pk7 per NSCs) harvested at day 7 and 14 postinjection. Percent of GFAP-positive cells was measured by fluorescence-activated cell sorting from the injected brains. Animals receiving virus loaded into NSCs showed significant decrease in % GFAP-positive cells in the brains compared to the group that received virus alone. (c) Percent of GFAP-positive cells was significantly decreased in the mouse brains injected with CRAd-S-pk7 loaded NSCs; **P < 0.005 versus CRAd-S-pk7 alone group at day 14 postinjection. (d) Analysis of expression of innate immune response genes expression post loading with 50 I.U. of CRAd-S-pk7 virus per NSCs by quantitative RT-PCR (qRT-PCR); (e) IL-10 production by NSC infected with CRAd-S-pk7 virus (50 I.U./cell). ELISA was performed for the quantification of the cytokines on the cell culture supernatant; **P < 0.005 in comparison with the uninfected NSCs.*P < 0.05, **P < 0.005 versus uninfected control. GFAP, glial fibrillary acidic protein; PBS, phosphate-buffered saline.
Figure 6
Figure 6
Oncolytic virus–loaded neural stem cells (NSCs) inhibit xenograft growth and prolong survival of mice with orthotopic glioblastoma. 2.5 × 10⁵ U87 cells were injected stereotactically into the right hemisphere of the brains of 9- to 12-week-old nu/nu mice followed by intratumoral (IT) injection of CRAd-S-pk7 alone (2.5 × 10⁷ I.U./animal) or loaded into NSCs (5 × 10⁵ NSC/animal loaded with 50 I.U./NSC, total 2.5 × 10⁷ I.U. viral dose) at 5 days after tumor implantation. The median survival was 56 days in group receiving phosphate-buffered saline (PBS) injection compared with 63 days in the group treated with virus alone and 93 days in the group treated with NSCs loaded with oncolytic virus, n = 9, [log-rank, PBS versus CRAd-S-pk7 (2.5 × 10⁷ I.U.), P = 0.0049; PBS versus ReNcell + CRAd-S-pk7 (5 × 10⁶ I.U.), P < 0.0001; CRAd-S-pk7 versus ReNcell + CRAd-S-pk7 (2.5 × 10⁷ I.U.), P = 0.0007].

References

    1. Deorah S, Lynch CF, Sibenaller ZA., and, Ryken TC. Trends in brain cancer incidence and survival in the United States: Surveillance, Epidemiology, and End Results Program, 1973 to 2001. Neurosurg Focus. 2006;20:E1. - PubMed
    1. Dey M, Ulasov IV., and, Lesniak MS. Virotherapy against malignant glioma stem cells. Cancer Lett. 2010;289:1–10. - PMC - PubMed
    1. Fisher K. Striking out at disseminated metastases: the systemic delivery of oncolytic viruses. Curr Opin Mol Ther. 2006;8:301–313. - PubMed
    1. Aboody KS, Brown A, Rainov NG, Bower KA, Liu S, Yang W.et al. (2000Neural stem cells display extensive tropism for pathology in adult brain: evidence from intracranial gliomas Proc Natl Acad Sci USA 9712846–12851. - PMC - PubMed
    1. Benedetti S, Pirola B, Pollo B, Magrassi L, Bruzzone MG, Rigamonti D.et al. (2000Gene therapy of experimental brain tumors using neural progenitor cells Nat Med 6447–450. - PubMed

Publication types