. 2011:2:330.
doi: 10.1038/ncomms1332.

TRAF6 ubiquitinates TGFβ type I receptor to promote its cleavage and nuclear translocation in cancer

Affiliations
Free PMC article

TRAF6 ubiquitinates TGFβ type I receptor to promote its cleavage and nuclear translocation in cancer

Yabing Mu et al. Nat Commun. 2011.
Free PMC article

Abstract

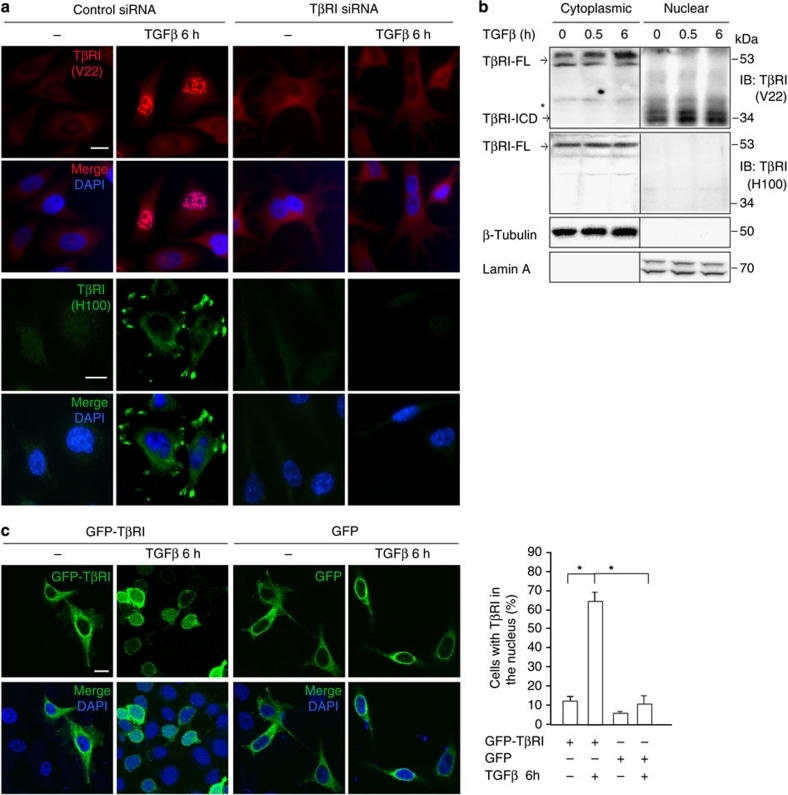
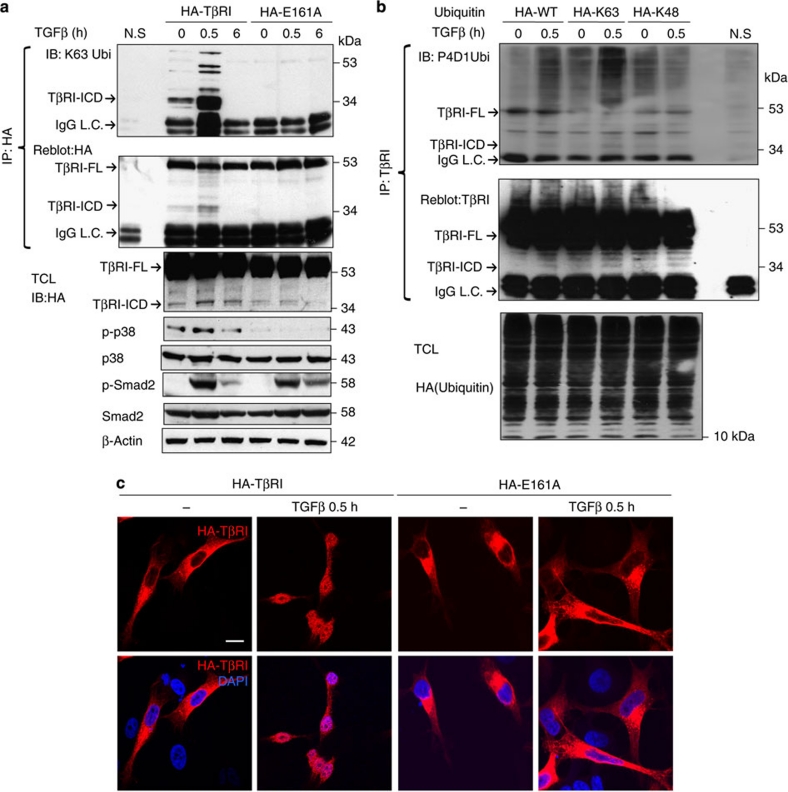
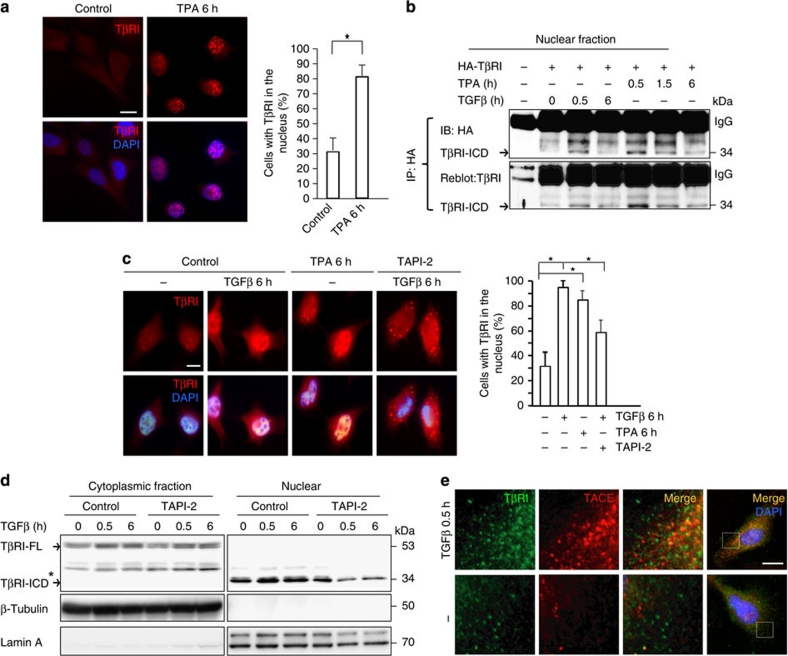
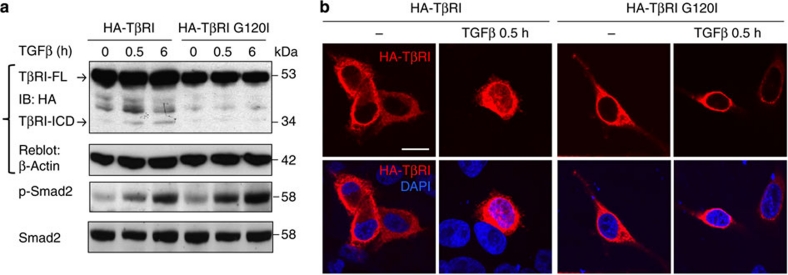
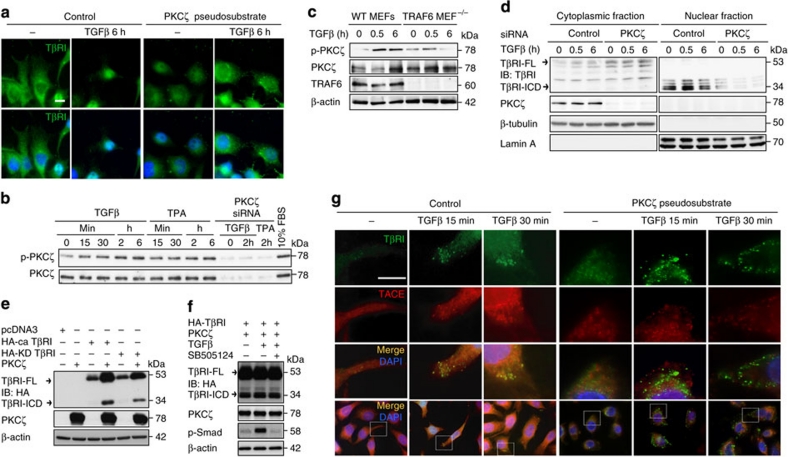
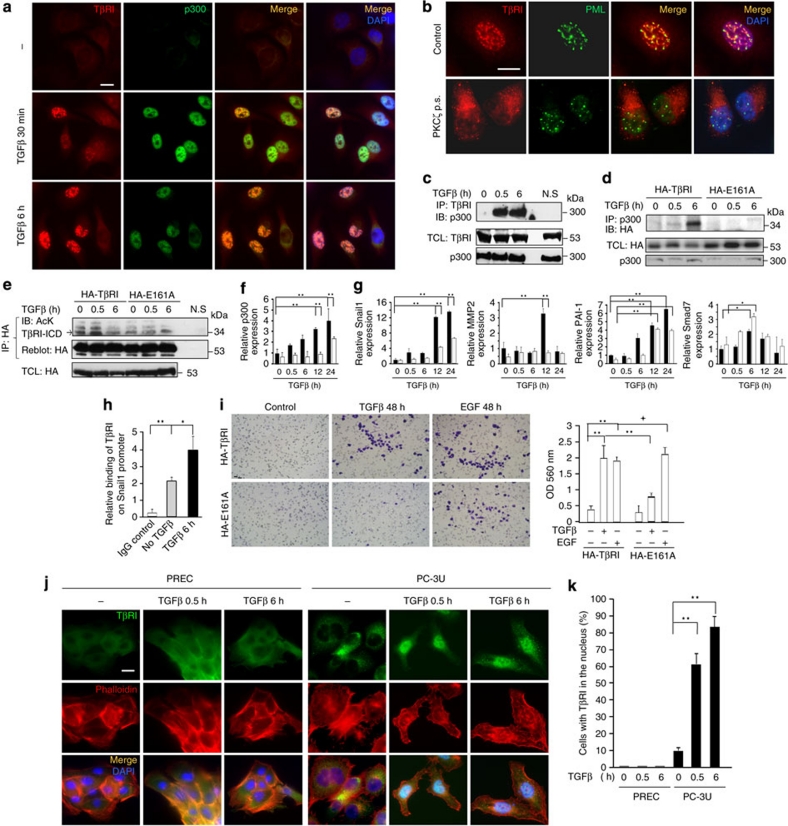
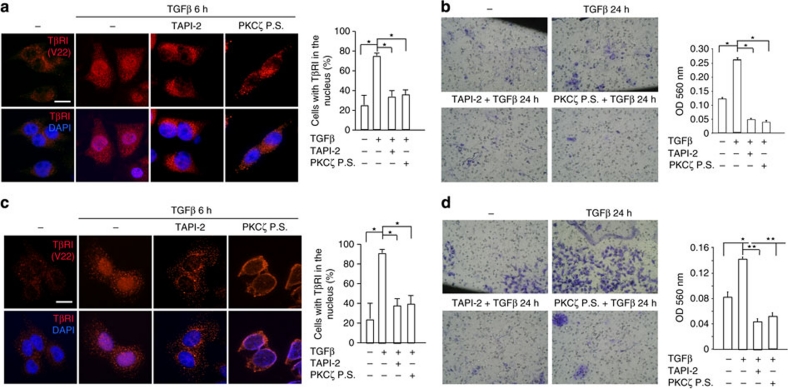
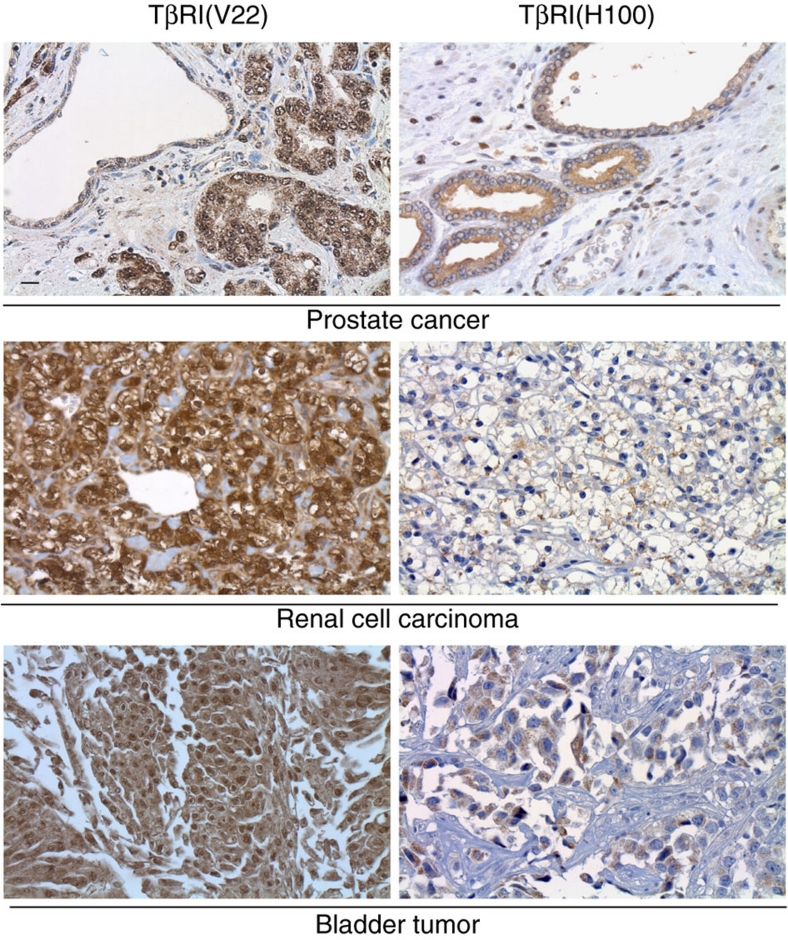
Transforming growth factor β (TGFβ) is a pluripotent cytokine promoting epithelial cell plasticity during morphogenesis and tumour progression. TGFβ binding to type II and type I serine/threonine kinase receptors (TβRII and TβRI) causes activation of different intracellular signaling pathways. TβRI is associated with the ubiquitin ligase tumor necrosis factor receptor (TNFR)-associated factor 6 (TRAF6). Here we show that TGFβ, via TRAF6, causes Lys63-linked polyubiquitination of TβRI, promoting cleavage of TβRI by TNF-alpha converting enzyme (TACE), in a PKCζ-dependent manner. The liberated intracellular domain (ICD) of TβRI associates with the transcriptional regulator p300 to activate genes involved in tumour cell invasiveness, such as Snail and MMP2. Moreover, TGFβ-induced invasion of cancer cells is TACE- and PKCζ- dependent and the TβRI ICD is localized in the nuclei of different kinds of tumour cells in tissue sections. Thus, our data reveal a specific role for TβRI in TGFβ mediated tumour invasion.


Figures

Figure 1
Figure 1. TGFβ induces nuclear accumulation of TβRI intracellular domain (TβRI-ICD).
(a, b) Knockdown of TβRI by siRNA was performed to demonstrate the specificity of the V22 and H100 antibodies, which recognize the intracellular and extracellular domain of TβRI, respectively, in immunofluorescence (a; DAPI was used to visualize cell nuclei, scale bar 20 μm). (b) Cell lysates of PC-3U cells treated or not with TGFβ, were fractionated into cytoplasmic and nuclear proteins and subjected to SDS–gel electrophoresis, followed by immunoblotting using V22 and H100 antibodies. β-tubulin and lamin A served as controls for the cytoplasmic and nuclear fractions, respectively. Molecular weight markers are indicated. (c) Representative confocal microscopy pictures of C-terminally pEGFP-N3-tagged wt TβRI (GFP- TβRI) and pEGFP-N3-vector (GFP) expressed in PC-3U cells treated with TGFβ for 6 h are shown (left panel) and quantified in right panel (mean±s.d., n=3–5 independent experiments where N=350 cells where counted in each group, *P<0.0002, ANOVA). Cell nuclei were stained with DAPI. Scale bar 20 μm.
Figure 2
Figure 2. TRAF6 promotes Lys63-dependent polyubiquitination of wt TβRI but not of the E161A mutant TβRI.
(a) PC-3U cells transiently transfected with C-terminally HA-tagged wt TβRI, or E161A mutant TβRI deficient in association with TRAF6, were treated or not with TGFβ, whereafter ubiquitination of TβRI was examined by an in vivo ubiquitination assay. Complexes immunoprecipitated (IP) with anti-HA antibodies were immunoblotted (IB) with Lys63 (K63)-linked polyubiquitin-specific antibody. A light-chain specific secondary antiserum was used to avoid cross-reaction with IgG heavy chain. Molecular weight markers are indicated. Another part of the corresponding total cell lysates (TCL) was subjected to immunoblotting for HA to detect the TβRI-ICD fragment, and activation of p38 and Smad2, by phospho-specific antisera. The filters were then reprobed with total p38 or Smad2, to verify specificity of phospho-specific antisera and actin served as internal control for equal loading of proteins. (b) In vivo ubiquitination assays performed in PC-3U cells transiently transfected with HA-tagged wt, K63- and K48-only ubiquitin. Cell lysates were immunoprecipitated with V22 antibody against TβRI, and K63-dependent polyubiquitination was visualized by immunoblotting with P4D1-antiserum. A light-chain specific secondary antiserum was used to avoid cross-reaction with IgG heavy chain. The TCL-filter was subjected to immunoblotting with an HA-antibody to verify equal expression levels of ubiquitin. (c) PC-3U cells ectopically expressing C-terminally HA-tagged wt TβRI or the corresponding E161A mutant were stimulated with TGFβ for 0.5 h and thereafter stained with an HA antibody. Staining with DAPI was used to visualize cell nuclei. Scale bar 20 μm.
Figure 3
Figure 3. TACE regulates nuclear accumulation of TβRI ICD.
(a) PC-3U cells were treated with TPA for 6 h. Endogenous TβRI is shown by immunofluorescence using the V22 antibody. Quantification of the number of cells showing endogenous TβRI in the nucleus is shown on the right side of the panel (mean±s.d., n=3 independent experiment, where N=200–300 cells where counted in each group, *P<0.0001, ANOVA). Scale bar 20 μm. (b) Nuclear proteins from PC-3U cells transiently transfected with C-terminally HA-tagged TβRI were treated as indicated, then samples were subjected to immunoprecipitation with an HA antibody. The TβRI-ICD was visualized by immunoblotting with an HA antibody and the membrane was thereafter stripped and reblotted with VPN antiserum against the intracellular part of the receptor. (c) PC-3U cells were treated with either TGFβ or TPA alone for 6 h or with both TGFβ and TAPI-2 for 6 h. Endogenous TβRI is shown by immunofluorescence using the V22 antibody. Quantification of the number of cells showing endogenous TβRI in the nucleus is shown on the right side of the panel (mean±s.d, n=3 independent experiments, where N=200–300 cells where counted from each group, *P<0.0001, ANOVA). Scale bar 20 μm. (d) Cell lysates of PC-3U cells treated with TGFβ in the presence or absence of TAPI-2 as indicated, were fractionated into cytoplasmic and nuclear proteins and subjected to SDS-gel electrophoresis, followed by immunoblotting using V22 antibody, which recognizes both the TβRI full length (TβRI-FL) and intracellular domain of TβRI (TβRI-ICD). β-tubulin and lamin A served as controls for the cytoplasmic and nuclear fractions, respectively. Molecular weight markers are indicated. *indicates a background band. (e) PC-3U cells were with treated or not with TGFβ for 0.5 h. Endogenous TACE and TβRI are shown by co-immunofluorescence using TACE (TRITC) and V22 (FITC) antisera. Their colocalization is demonstrated by the yellow colour as shown in merge. The pictures are enlargements of the picture to the right (white box). Scale bar 20 μm. Stainings with DAPI was used to visualize cell nuclei in (a, c and e).
Figure 4
Figure 4. Identification of the TGFβ-induced cleavage site for TACE in the extracellular domain of TβRI.
(a) Total cell lysates derived from PC-3U cells transiently transfected with C-terminally HA-tagged wt TβRI or the corresponding G120I mutant were stimulated with TGFβ as indicated, was subjected to immunoblotting for HA to detect the TβRI-ICD fragment. The filter was reprobed with β-actin antibodies to show equal loading of proteins in all lanes, and activation of Smad2, by a phospho-specific antiserum (p-Smad2). The p-Smad2 filter was reblotted with total Smad2. (b) Representative confocal microscopy pictures of PC-3U cells ectopically expressing C-terminally HA-tagged wt TβRI or the corresponding G120I mutant were stimulated with TGFβ for 0.5 h and thereafter stained with HA antibody. Staining with DAPI was used to visualize cell nuclei. Scale bar 20 μm.
Figure 5
Figure 5. PKCζ promotes nuclear accumulation of TβRI.
(a) Immunofluorescence of endogenous TβRI visualized with the V22 antibody in PC-3U cells treated with TGFβ with or without PKCζ pseudosubstrate to inhibit PKCζ. Scale bar 20 μm. (b) Cell lysates from PC-3U cells treated with TGFβ or TPA were subjected to immunoblotting with pPKCζ antibody. Total cell lysates from cells transiently transfected with PKCζ siRNA served as negative control and cells treated with 10% FBS as positive control. The filter was reprobed with PKCζ antiserum to show equal loading of proteins in all lanes. (c) Cell lysates from wt and TRAF6−/− MEFs was subjected to immunoblotting for p-PKCζ,/PKCζ, TRAF6 and β-actin antibodies to show activation of PKCζ, knock down of TRAF6, and equal loading of proteins in all lanes, respectively. (d) PC-3U cells, in which endogenous PKCζ was silenced by its siRNA or not, and then treated with TGFβ, were subjected to cell fractionation followed by SDS–gel electrophoresis and immunoblotting to investigate the subcellular localization of endogenous TβRI. Lamin A and β-tubulin served as controls for the nuclear and cytoplasmic fractions, respectively. (e) Cell lysates from PC-3U cells transiently transfected and treated as indicated, in the presence or absence of wt PKCζ, subjected to immunoblotting to visualize TβRI-FL and TβRI-ICD. Immunoblotting of cell lysates for PKCζ and β-actin served as controls for the experiment. (f) Cell lysates from PC-3U cells transiently transfected with C-terminally HA-tagged wt TβRI and wt PKCζ, and treated with TGFβ in the presence and absence of TβRI inhibitor (SB505124) , subjected to immunoblotting for HA to visualize TβRI-FL and TβRI-ICD. Immunoblotting of cell lysates for PKCζ, p-Smad2 and β-actin served as controls for the experiment. (g) PC-3U cells were treated with TGFβ, with or without the PKCζ pseudosubstrate. Endogenous TACE and TβRI were visualized by immunofluorescence using TACE (TRITC) and V22 (FITC) antisera. Their colocalization is demonstrated by the yellow colour as shown in merge. Scale bar 20 μm. Stainings with DAPI was used to visualize cell nuclei in a, g.
Figure 6
Figure 6. TβRI promotes expression of Snail and invasion of prostate cancer cells in a TGFβ-dependent manner.
(a) PC-3U cells were treated with or without TGFβ. Endogenous TβRI and p300 are visualized by immunofluorescence using V22 (TRITC) and p300 (FITC) antibodies. Note the TGFβ-induced nuclear accumulation of endogenous TβRI and colocalization with p300 (shown in merge; yellow). (b) PC-3U cells were treated as indicated. Endogenous TβRI and PML are shown by immunofluorescence using V22 (TRITC) and PML (FITC) antisera. (c) TGFβ induces association between endogenous TβRI and p300. Cell lysates from PC-3U cells treated with TGFβ were immunoprecipitated with the V22 antibody against TβRI and subjected to immunoblotting with p300 antibody. (d) Cell lysates from PC-3U cells transiently transfected and treated as indicated, were immunoprecipitated with an antibody against p300 and subjected to immunoblotting with HA antibody. (e) Cell lysates from PC-3U cells, transiently transfected and treated as indicated, were immunoprecipitated with an antibody against HA and subjected to immunoblotting with acetyl-Lys (AcK) antibody. (f, g) qRT-PCR analysis for expression of p300, Snail-1, MMP2, PAI1 and Smad7 was performed on mRNA extracted from PC-3U cells transiently transfected with wt HA-TβRI (filled bars) or the E161A mutant (open bars) and treated as indicated. (h) Chromatin immunoprecipitation assay for the Snail promoter using V22 antibody against the endogenous TβRI in PC-3U cells treated or not with TGFβ. (i) Invasion assay for PC-3U cells, transiently transfected and treated as indicated. Cells were visualized by staining with crystal violet cell stain solution. Right panel presents mean values for optical density (OD) of invasive cells. (j) Immunofluorescence stainings of cytoskeletal reorganization of actin and subcellular localization of TβRI in TGFβ-treated primary prostate epithelial cells (PREC) and PC-3U cells for comparison. (k) Quantification of the number of cells in (j) showing endogenous TβRI in the nucleus, where N=200 cells were counted in each group. (a, b, j) Staining with DAPI was used to visualize cell nuclei. Scale bar 20 μm. Data in (f, g, h, i, k) are representative of three independent experiments (mean and s.d). *P<0.05 and **P<0.005 (ANOVA except for relative Smad7 expression, where Students t-test were used).
Figure 7
Figure 7. TβRI nuclear localization in human breast and lung carcinoma cells is associated with tumour invasion.
(a) Human breast carcinoma (MDA-MB-231) cells were starved and treated with TGFβ in the presence or absence of the PKCζ pseudosubstrate (P.S.) or TAPI-2, as indicated. Endogenous C-terminal TβRI was visualized by immunofluorescence using the V22 antibody (TRITC). Quantification of the number of cells showing endogenous TβRI in the nucleus is shown on the right side of the panel (mean±s.d., n=3 independent experiment, where N=200–300 cells where counted in each group, *P<0.001, ANOVA). Scale bar 20 μm. (b) Invasion assay for MDA-MB-231 treated with TGFβ in the absence or presence of TAPI-2 and PKCζ P.S. Cells were visualized by staining with crystal violet cell stain solution. Right panel presents mean values for optical density (OD) of invasive cells. Error bars represents s.d. (n=3 independent experiments, *P<0.05; Students t-test). (c) Human lung carcinoma (A549) cell were starved and treated with TGFβ in the presence or absence of the PKCζ P.S or TAPI-2, as indicated. Endogenous C-terminal TβRI was visualized by immunofluorescence using the V22 antibody (TRITC). Quantification of the number of cells showing endogenous TβRI in the nucleus is shown on the right side of the panel (mean±s.d., n=3 independent experiment, where N=200-300 cells where counted in each group, *P<0.0003, ANOVA). Scale bar 20 μm. (d) Invasion assay for A549 cells treated with TGFβ in the absence or presence of TAPI-2 and PKCζ P.S. Cells were visualized by staining with crystal violet cell stain solution. Right panel presents mean values for OD of invasive cells. Error bars represents mean±s.d. (n=3 independent experiments; *P<0.05, **P<0.002, ANOVA).
Figure 8
Figure 8. TβRI ICD is localized in nucleus in different kinds of malignant tumours.
Tumour tissues from prostate cancer, renal cell carcinoma and bladder tumour were stained with V22 and H100 antibodies, which recognize the intracellular and extracellular domain of TβRI, respectively. Scale bar 20 μm.

References

    1. Groppe J. et al. Cooperative assembly of TGF-beta superfamily signaling complexes is mediated by two disparate mechanisms and distinct modes of receptor binding. Mol. Cell 29, 157–168 (2008). - PubMed
    1. Massagué J. TGFbeta in Cancer. Cell 134, 215–230 (2008). - PMC - PubMed
    1. Heldin C.- H., Landstrom M. & Moustakas A. Mechanism of TGF-β signaling to growth arrest, apoptosis and epithelial-mesenchymal transition. Curr. Opion in Cell Biology 21, 1–11 (2009). - PubMed
    1. Hayes S., Chawla A. & Corvera S. TGF beta receptor internalization into EEA1-enriched early endosomes: role in signaling to Smad2. J. Cell Biol. 158, 1239–1249 (2002). - PMC - PubMed
    1. Sorrentino A. et al. The type I TGF-beta receptor engages TRAF6 to activate TAK1 in a receptor kinase-independent manner. Nat. Cell Biol. 10, 1199–1207 (2008). - PubMed

Publication types

MeSH terms