

Evaluation of spectral domain and time domain optical coherence tomography findings in toxoplasmic retinochoroiditis
- PMID: 21629569
- PMCID: PMC3104792
- DOI: 10.2147/OPTH.S20033
Evaluation of spectral domain and time domain optical coherence tomography findings in toxoplasmic retinochoroiditis
Abstract
Purpose: To investigate spectral domain optical coherence tomography (SD-OCT) findings and compare them with time domain (TD)-OCT imaging of macula and retinochoroiditis lesions of patients with toxoplasmosis.
Design: Prospective cross-sectional study.
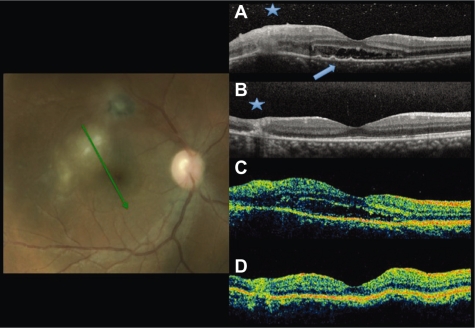
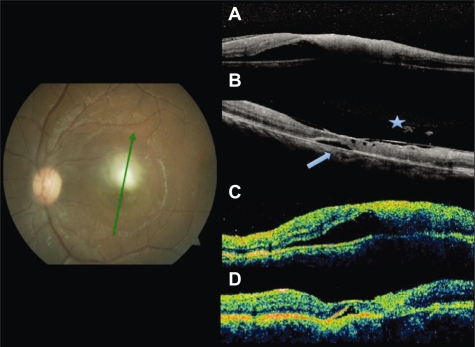
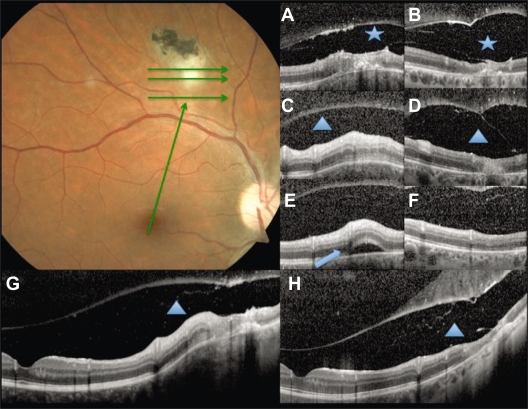
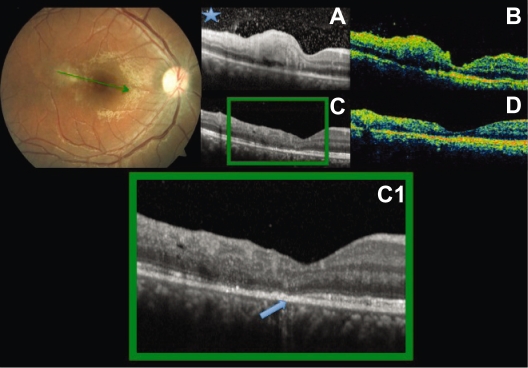
Methods: Ten eyes of 10 patients with active toxoplasmic retinochoroiditis were included. Morphologic features from the macula and retinochoroiditis lesions were obtained at baseline and at 6-week follow up. Scan acquisition protocols for TD-OCT included raster and radial lines through the retinochoroiditis lesion, fast macular, and a linear scan from the lesion to the fovea, whereas the acquisition protocols for SD-OCT also included horizontal volume scans at the lesion site and at the macula. Thickness measurements obtained by SD-OCT were analyzed.
Results: At baseline, macular serous retinal detachment was observed in five patients; two of them only seen by SD-OCT. Retinochoroidal lesions were 4260 μm distant from the fovea on average (R = 681-7130) and this distance had an indirect correlation to the presence of macular detachment. Epiretinal membrane and vitreo-macular traction were also observed. The posterior hyaloid was not identified in four patients by TD-OCT and only in one by SD-OCT at baseline. Perilesional subretinal fluid was observed in two patients. The median retinal thickness significantly decreased at the retinochoroiditis lesion (P = 0.0004), and all the patients remained with disorganized retinal layers reflectivity at follow up.
Conclusion: SD-OCT is a useful tool in the diagnosis of macular changes related with toxoplasmic retinochoroiditis. SD-OCT is superior in evaluating retinal changes associated with ocular toxoplasmosis.
Keywords: optical coherence tomography; retinochoroiditis; toxoplasmosis.
Figures
References
-
- Jones JL, Dargelas V, Roberts J, Press C, Remington JS, Montoya JG. Risk factors for Toxoplasma gondii infection in the United States. Clin Infect Dis. 2009;49(6):878–884. - PubMed
-
- Bonfioli AA, Orefice F. Toxoplasmosis. Semin Ophthalmol. 2005;20(3):129–141. - PubMed
-
- Nussenblatt RB, Belfort R., Jr Ocular toxoplasmosis. An old disease revisited. JAMA. 1994;271(4):304–307. - PubMed
-
- Holland GN. Ocular toxoplasmosis: a global reassessment. Part II: disease manifestations and management. Am J Ophthalmol. 2004;137:1–17. - PubMed
-
- Gupta V, Gupta P, Singh R, Dogra MR, Gupta A. Spectral-domain Cirrus high-definition optical coherence tomography is better than time-domain Stratus optical coherence tomography for evaluation of macular pathologic features in uveitis. Am J Ophthalmol. 2008;145(6):1018–1022. - PubMed
LinkOut - more resources
Full Text Sources
Medical
