. 2010 Jun;4(2):133-49.
doi: 10.1007/s11571-010-9107-z. Epub 2010 Mar 6.

A method for the estimation of functional brain connectivity from time-series data

Affiliations

A method for the estimation of functional brain connectivity from time-series data

A Wilmer et al. Cogn Neurodyn. 2010 Jun.

Abstract

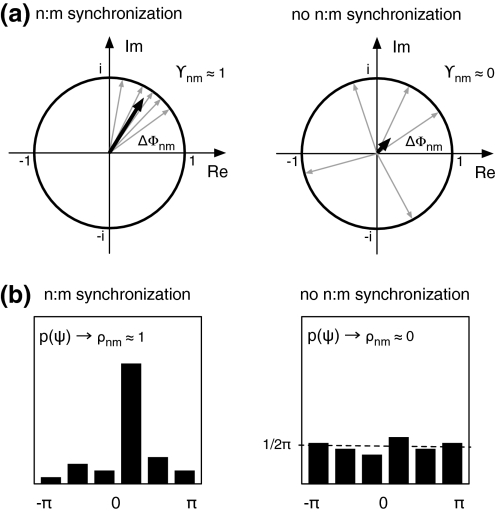
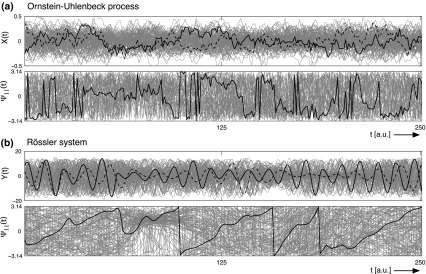
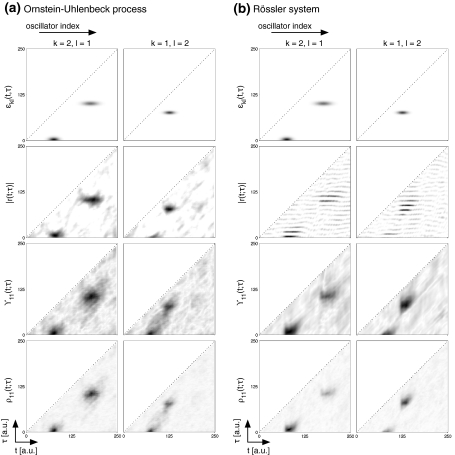
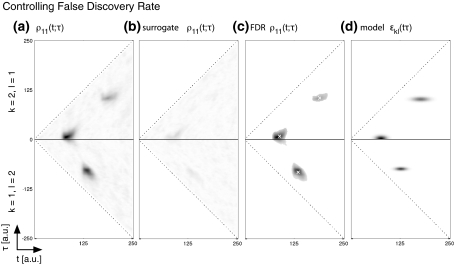
A central issue in cognitive neuroscience is which cortical areas are involved in managing information processing in a cognitive task and to understand their temporal interactions. Since the transfer of information in the form of electrical activity from one cortical region will in turn evoke electrical activity in other regions, the analysis of temporal synchronization provides a tool to understand neuronal information processing between cortical regions. We adopt a method for revealing time-dependent functional connectivity. We apply statistical analyses of phases to recover the information flow and the functional connectivity between cortical regions for high temporal resolution data. We further develop an evaluation method for these techniques based on two kinds of model networks. These networks consist of coupled Rössler attractors or of coupled stochastic Ornstein-Uhlenbeck systems. The implemented time-dependent coupling includes uni- and bi-directional connectivities as well as time delayed feedback. The synchronization dynamics of these networks are analyzed using the mean phase coherence, based on averaging over phase-differences, and the general synchronization index. The latter is based on the Shannon entropy. The combination of these with a parametric time delay forms the basis of a connectivity pattern, which includes the temporal and time lagged dynamics of the synchronization between two sources. We model and discuss potential artifacts. We find that the general phase measures are remarkably stable. They produce highly comparable results for stochastic and periodic systems. Moreover, the methods proves useful for identifying brief periods of phase coupling and delays. Therefore, we propose that the method is useful as a basis for generating potential functional connective models.

Keywords: Functional connectivity; MEG magnetencephalography; Network analysis; Time-delayed phase synchronization.


Figures

Fig. 1
Fig. 1
Estimation of synchronization is done by (a) the average-based γnm and (b) a normed entropy-based ρnm. γnm represents the length of averaged unit pointers in the complex plane, whose directions are given by the phase difference. To calculate ρnm the probability of the cyclic phase differences has to be calculated first. A peaked distribution is an indication for a synchronized state
Fig. 2
Fig. 2
100 simulated trials of the Ornstein–Uhlenbeck (a) and the Rössler system (b). In (a) two corresponding time series of the amplitudes X(t) and cyclic phase differences ψ11(t) for the Ornstein–Uhlenbeck process are plotted in black. The gray colored line plots show the remaining other trials. In (b) the data for the two linked Rössler oscillators are pictured. As amplitude data the y-component Y(t) of each system is taken. Synchronization with τ = 0 occurs around t = 75 (cf. Table. 1)
Fig. 3
Fig. 3
Results of the synchronization analysis for (a) two Ornstein–Uhlenbeck processes and (b) two Rössler oscillators. The scalar field ɛkl(t, τ) denotes the a priori given coupling density, which is used for the simulation of the data. The window size for the central moving average was chosen with ΔT = 9 time steps for the analysis. The amplitude in the plot for each measure is normalized. Dark values indicate high synchronization or correlation respectively
Fig. 4
Fig. 4
The Jensen–Shannon divergence is calculated as a similarity measure between the estimates |r|, γ, ρ and the a priori known coupling strength ɛ in dependence of the moving time window sized ΔT time steps for the Ornstein–Uhlenbeck system (a) and the Rössler system (b)
Fig. 5
Fig. 5
A schematic reduction of the time-dependent connectivities ɛkl(t,τ) to time-dependent graphs is used to explain appearing artifacts in data: (a) unidirectionality, (b) competition between two driving systems and two special cases of indirect driving (ci) and (cii)
Fig. 6
Fig. 6
Prediction of artifacts in a 3 × 3 network of Rössler oscillators with the a priori known coupling density ɛkl(t,τ) in (a) and the numerical results in (b) for the synchronization index ρ11(t;τ). The colored labels in (a) are consistent with Fig. 5
Fig. 7
Fig. 7
Illustration for the connectivities of the reduced patterns ɛkl(t,τ) shown in Fig. 6. The labels a–c correspond to the different cases of Fig. 5
Fig. 8
Fig. 8
The synchronicity within a connectivity pattern can be thresholded by a false discovery rate (FDR) control. Two corresponding patterns (for k = 2, l = 1 and k = 1, l = 2) are concatenated. (a) The phase synchronization index as in Fig. 3 of the Rössler system. (b) The synchronization of the surrogate data. (c) The image is thresholded by a applying a FDR control with a tolerated false discovery rate of q = 0.001. The center of mass for each cluster is indicated by a white cross. The coordinates of the clusters can be found in Table 1. (d) The coupling strengths ɛkl(t, τ) for generating the data

References

    1. Angelini L, Pellicoro M, and Stramaglia S (2009) Granger causality for circular variables. Phys Lett A 373(29):2467–2470. doi:10.1016/j.physleta.2009.05.009
    1. Assisi CG, Jirsa VK, Kelso JAS. Synchrony and clustering in heterogeneous networks with global coupling and parameter dispersion. Phys Rev Lett. 2005;94(1):018106. doi: 10.1103/PhysRevLett.94.018106. - DOI - PubMed
    1. Atmanspacher H, Rotter S. Interpreting neurodynamics: concepts and facts. Cogn Neurodyn. 2008;2(4):297–318. doi: 10.1007/s11571-008-9067-8. - DOI - PMC - PubMed
    1. Barnes GR, Hillebrand A, Fawcett IP, Singh KD. Realistic spatial sampling for MEG beamformer images. Hum Brain Mapp. 2004;23:120–127. doi: 10.1002/hbm.20047. - DOI - PMC - PubMed
    1. Benjamini Y, Hochberg Y. Controlling the false discovery rate: a practical and powerful approach to multiple testing. J R Stat Soc Series B Methodol. 1995;57(1):289–300.