

Characterizing the epidemiology of the 2009 influenza A/H1N1 pandemic in Mexico
- PMID: 21629683
- PMCID: PMC3101203
- DOI: 10.1371/journal.pmed.1000436
Characterizing the epidemiology of the 2009 influenza A/H1N1 pandemic in Mexico
Abstract
Background: Mexico's local and national authorities initiated an intense public health response during the early stages of the 2009 A/H1N1 pandemic. In this study we analyzed the epidemiological patterns of the pandemic during April-December 2009 in Mexico and evaluated the impact of nonmedical interventions, school cycles, and demographic factors on influenza transmission.
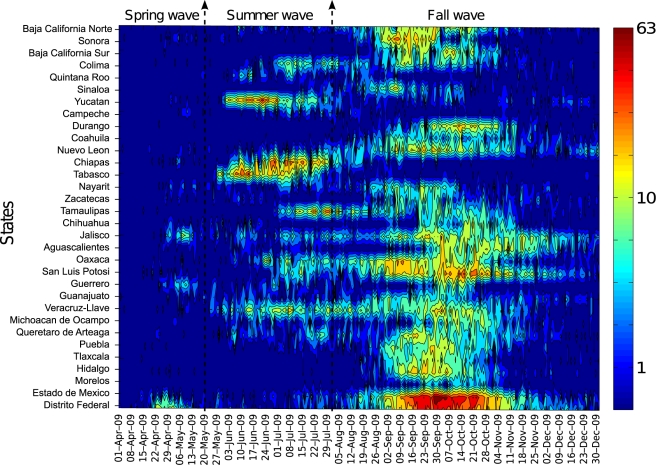
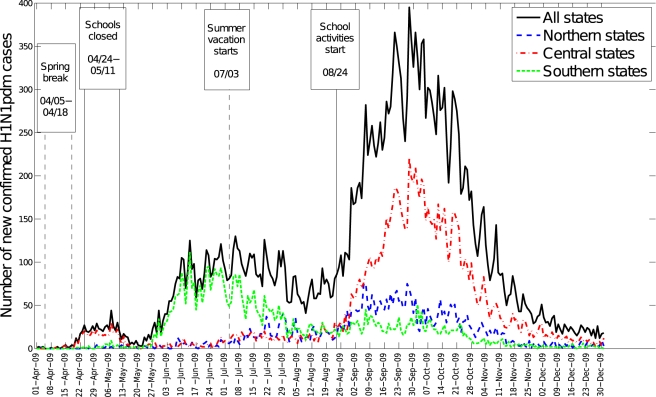
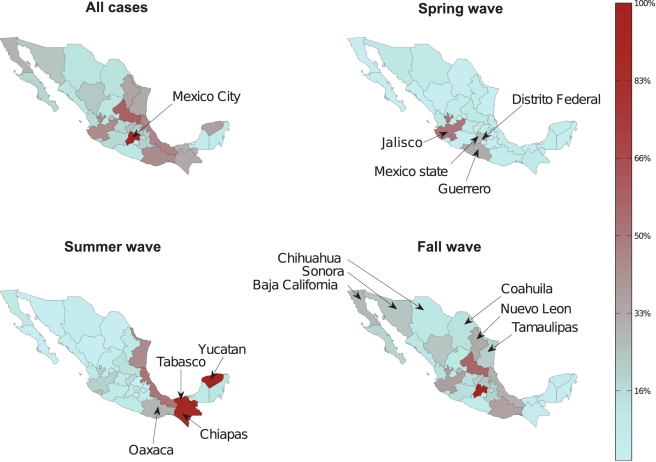
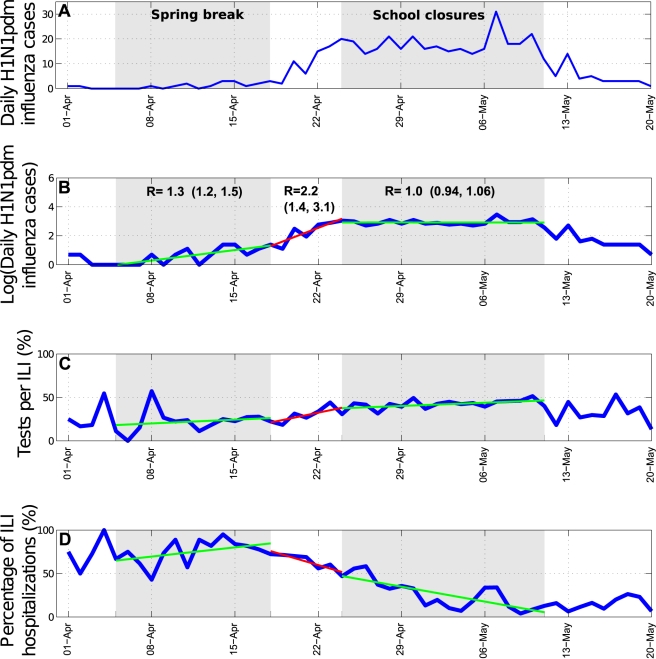
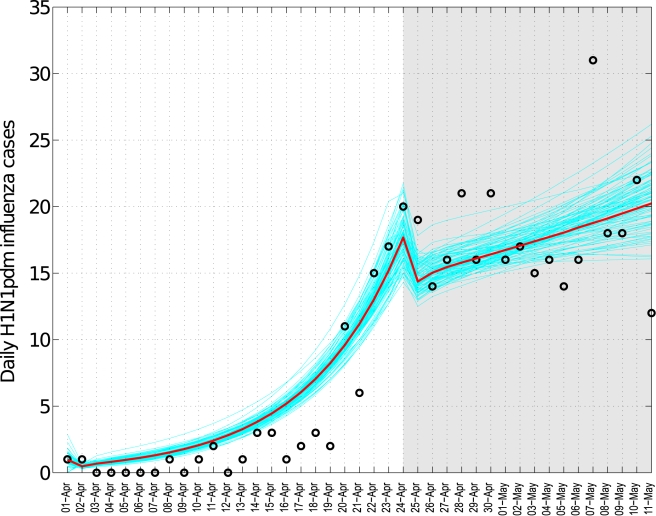
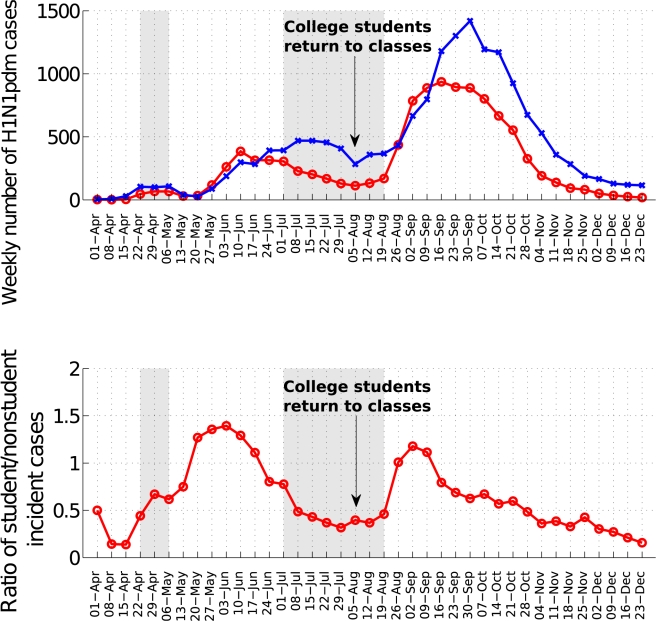
Methods and findings: We used influenza surveillance data compiled by the Mexican Institute for Social Security, representing 40% of the population, to study patterns in influenza-like illness (ILIs) hospitalizations, deaths, and case-fatality rate by pandemic wave and geographical region. We also estimated the reproduction number (R) on the basis of the growth rate of daily cases, and used a transmission model to evaluate the effectiveness of mitigation strategies initiated during the spring pandemic wave. A total of 117,626 ILI cases were identified during April-December 2009, of which 30.6% were tested for influenza, and 23.3% were positive for the influenza A/H1N1 pandemic virus. A three-wave pandemic profile was identified, with an initial wave in April-May (Mexico City area), a second wave in June-July (southeastern states), and a geographically widespread third wave in August-December. The median age of laboratory confirmed ILI cases was ∼ 18 years overall and increased to ∼ 31 years during autumn (p<0.0001). The case-fatality ratio among ILI cases was 1.2% overall, and highest (5.5%) among people over 60 years. The regional R estimates were 1.8-2.1, 1.6-1.9, and 1.2-1.3 for the spring, summer, and fall waves, respectively. We estimate that the 18-day period of mandatory school closures and other social distancing measures implemented in the greater Mexico City area was associated with a 29%-37% reduction in influenza transmission in spring 2009. In addition, an increase in R was observed in late May and early June in the southeast states, after mandatory school suspension resumed and before summer vacation started. State-specific fall pandemic waves began 2-5 weeks after school reopened for the fall term, coinciding with an age shift in influenza cases.
Conclusions: We documented three spatially heterogeneous waves of the 2009 A/H1N1 pandemic virus in Mexico, which were characterized by a relatively young age distribution of cases. Our study highlights the importance of school cycles on the transmission dynamics of this pandemic influenza strain and suggests that school closure and other mitigation measures could be useful to mitigate future influenza pandemics. Please see later in the article for the Editors' Summary.
Conflict of interest statement
LS received consulting fees from SDI, a health data warehouse business in Pennsylvania, and received research support from Pfizer for a pneumococcal vaccine study, but this is not relevant to the topic of this paper. MAM has been named on a US government patent for an experimental influenza vaccine as required by Federal requirements.
Figures
References
-
- Chowell G, Bertozzi SM, Colchero MA, Lopez-Gatell H, Alpuche-Aranda C, et al. Severe respiratory disease concurrent with the circulation of H1N1 influenza. N Engl J Med. 2009;361:674–679. - PubMed
-
- Perez-Padilla R, de la Rosa-Zamboni D, Ponce de Leon S, Hernandez M, Quinones-Falconi F, et al. Pneumonia and respiratory failure from swine-origin influenza A (H1N1) in Mexico. N Engl J Med. 2009;361:680–689. - PubMed
-
- Swine influenza A (H1N1) infection in two children--Southern California, March-April 2009. MMWR Morb Mortal Wkly Rep. 2009;58:400–402. - PubMed
-
- Outbreak of swine-origin influenza A (H1N1) virus infection - Mexico, March-April 2009. MMWR Morb Mortal Wkly Rep. 2009;58:467–470. - PubMed
Publication types
MeSH terms
LinkOut - more resources
Full Text Sources
Medical
Miscellaneous
