. 2011:2011:687945.
doi: 10.4061/2011/687945. Epub 2011 Apr 19.

Multimodal Imaging of Alzheimer Pathophysiology in the Brain's Default Mode Network

Affiliations

Multimodal Imaging of Alzheimer Pathophysiology in the Brain's Default Mode Network

Jonghan Shin et al. Int J Alzheimers Dis. 2011.

Abstract

The spatial correlations between the brain's default mode network (DMN) and the brain regions known to develop pathophysiology in Alzheimer's disease (AD) have recently attracted much attention. In this paper, we compare results of different functional and structural imaging modalities, including MRI and PET, and highlight different patterns of anomalies observed within the DMN. Multitracer PET imaging in subjects with and without dementia has demonstrated that [C-11]PIB- and [F-18]FDDNP-binding patterns in patients with AD overlap within nodes of the brain's default network including the prefrontal, lateral parietal, lateral temporal, and posterior cingulate cortices, with the exception of the medial temporal cortex (especially, the hippocampus) where significant discrepancy between increased [F-18]FDDNP binding and negligible [C-11]PIB-binding was observed. [F-18]FDDNP binding in the medial temporal cortex-a key constituent of the DMN-coincides with both the presence of amyloid and tau pathology, and also with cortical areas with maximal atrophy as demonstrated by T1-weighted MR imaging of AD patients.


Figures

Figure 1
Figure 1
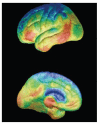
The brain's default network was originally identified in a meta-analysis that mapped brain regions more active in passive as compared to active tasks (often referred to as task-induced deactivation). The displayed [O-15]H2O positron emission tomography (PET) data include nine studies (132 young adults) from Shulman et al. [30] (reanalyzed in [21]). Images show the medial and lateral surface of the left hemisphere using a population-averaged surface representation to take into account between-subject variability in sulcal anatomy. Blue represents regions most active in passive task settings. Adapted and reprinted with permission from Buckner et al. [4, 21] [Copyright (2005) Journal of Neuroscience].
Figure 2
Figure 2
Patterns of grey matter atrophy in patients with AD compared with age-matched control group. The results are shown on a 3D surface render (top) and overlaid on representative axial, coronal and sagittal slices (bottom). L: left; R: right. Adapted and reprinted with permission from Whitwell et al. [18] [Copyright (2005) Brain].
Figure 3
Figure 3
Three-dimensional cortical surface projection images of [F-18]FDDNP-PET scans from a patient with AD. Lateral (upper) and medial (lower) brain surfaces are shown. Warmer colors indicate higher numbers of plaques and tangles. Adapted and reprinted with permission from Small et al. [16] [Copyright (2008) Lancet Neurology].
Figure 4
Figure 4
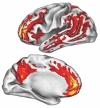
Surface maps indicating the pattern of [C-11]PIB binding obtained with 10 patients with clinical Alzheimer's disease compared with 29 healthy older control subjects. Adapted and reprinted with permission from Buckner et al. [21] [Copyright (2005) Journal of Neuroscience].
Figure 5
Figure 5
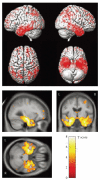
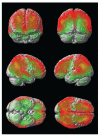
Comparison of [C-11]PIB SPM t-map image (red) and [F-18]FDDNP SPM t-map image (green) obtained with 10 AD patients compared with 10 healthy age-matched control subjects (P < .05, uncorrected, k = 100). The yellow area represents the area where the [C-11]PIB SPM t-map (red) and [F-18]FDDNP SPM t-map (green) overlapped. Adapted and reprinted with permission from Shin et al. [25] [Copyright (2010) Neuroimage].
Figure 6
Figure 6
[F-18]FDDNP minus [C-11]PIB results (yellow blobs) in the same patients with AD as statistical parameter mapping (SPM) projections superimposed on a standardized magnetic resonance imaging brain template in the three orthogonal right sagittal (upper left), coronal (upper right), and axial (lower left) views (P < .05 (FWE); corrected, k = 100). Adapted and reprinted with permission from Shin et al. [25] [Copyright (2010) Neuroimage].

References

    1. Gusnard DA, Raichle ME. Searching for a baseline: functional imaging and the resting human brain. Nature Reviews Neuroscience. 2001;2(10):685–694. - PubMed
    1. Andrews-Hanna JR, Reidler JS, Sepulcre J, Poulin R, Buckner RL. Functional-anatomic fractionation of the brain’s default network. Neuron. 2010;65(4):550–562. - PMC - PubMed
    1. Seeley WW, Crawford RK, Zhou J, Miller BL, Greicius MD. Neurodegenerative diseases target large-scale human brain networks. Neuron. 2009;62(1):42–52. - PMC - PubMed
    1. Buckner RL, Andrews-Hanna JR, Schacter DL. The brain’s default network: anatomy, function, and relevance to disease. Annals of the New York Academy of Sciences. 2008;1124:1–38. - PubMed
    1. Wermke M, Sorg C, Wohlschläger AM, Drzezga A. A new integrative model of cerebral activation, deactivation and default mode function in Alzheimer’s disease. European Journal of Nuclear Medicine and Molecular Imaging. 2008;35(1):S12–S24. - PubMed