. 2011 Mar 7:5:17.
doi: 10.3389/fnana.2011.00017. eCollection 2011.

Three-dimensional reconstruction of serial mouse brain sections: solution for flattening high-resolution large-scale mosaics

Affiliations

Three-dimensional reconstruction of serial mouse brain sections: solution for flattening high-resolution large-scale mosaics

Monica L Berlanga et al. Front Neuroanat. .

Abstract

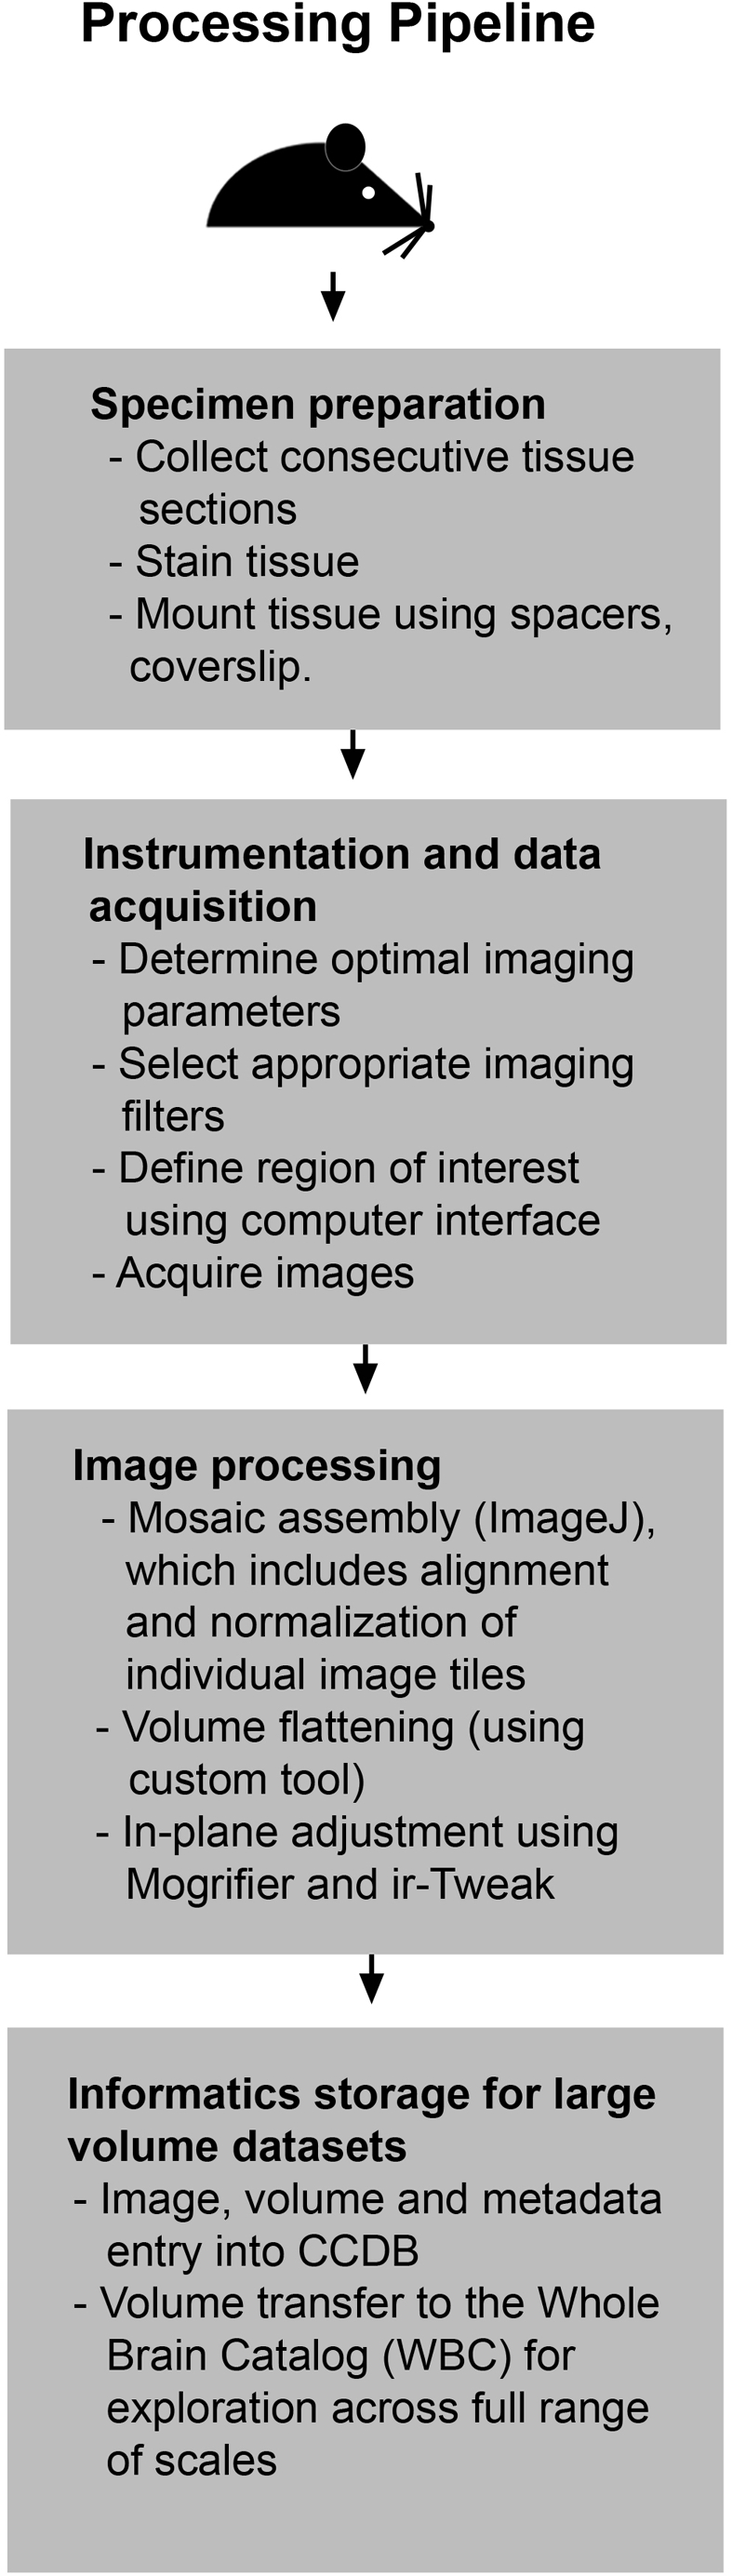
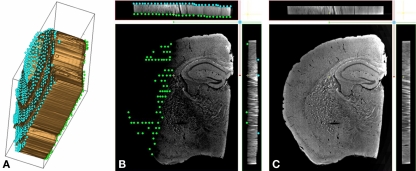
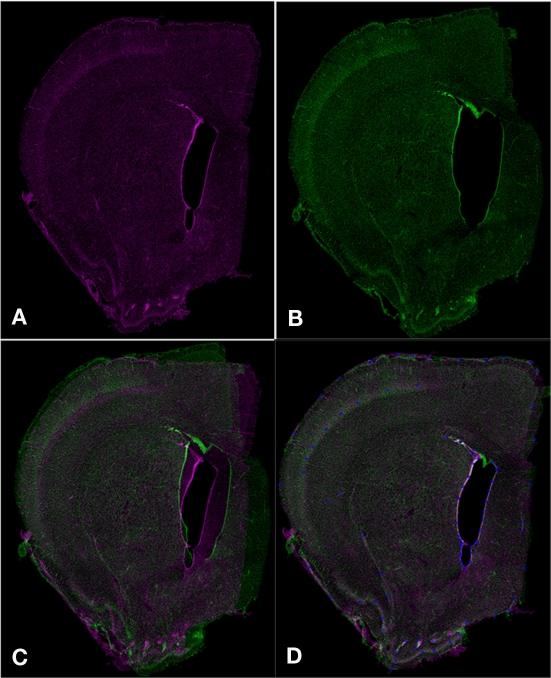
Recent advances in high-throughput technology facilitate massive data collection and sharing, enabling neuroscientists to explore the brain across a large range of spatial scales. One such form of high-throughput data collection is the construction of large-scale mosaic volumes using light microscopy (Chow et al., 2006; Price et al., 2006). With this technology, researchers can collect and analyze high-resolution digitized volumes of whole brain sections down to 0.2 μm. However, until recently, scientists lacked the tools to easily handle these large high-resolution datasets. Furthermore, artifacts resulting from specimen preparation limited volume reconstruction using this technique to only a single tissue section. In this paper, we carefully describe the steps we used to digitally reconstruct a series of consecutive mouse brain sections labeled with three stains, a stain for blood vessels (DiI), a nuclear stain (TO-PRO-3), and a myelin stain (FluoroMyelin). These stains label important neuroanatomical landmarks that are used for stacking the serial sections during reconstruction. In addition, we show that the use of two software applications, ir-Tweak and Mogrifier, in conjunction with a volume flattening procedure enable scientists to adeptly work with digitized volumes despite tears and thickness variations within tissue sections. These applications make processing large-scale brain mosaics more efficient. When used in combination with new database resources, these brain maps should allow researchers to extend the lifetime of their specimens indefinitely by preserving them in digital form, making them available for future analyses as our knowledge in the field of neuroscience continues to expand.

Keywords: cell centered database; confocal microscopy; connectivity; myelin; neuroinformatics; serial sections; warping correction; whole brain catalog.


Figures

Figure 1
Figure 1
Processing pipeline flowchart. This flowchart illustrates the steps required to generate a 3D reconstruction of serial large-scale brain mosaics starting with specimen preparation and ending with deposition of datasets into publicly available databases.
Figure 2
Figure 2
Volume flattening process. (A) Isosurface of a single mouse brain coronal section. The two boundary surfaces are delimited by two sets of points (in green and in blue). This 3D plot clearly shows the section unevenness that is corrected for during the flattening step. (B) XYZ view of a warped mouse brain coronal section within the IMOD viewer. The volume density has been converted from RGB to gray scale. Two objects consisting of a set of points (respectively in green and in blue) model the spatial variation of the section boundaries. These points are used as references during the flattening procedure. The specimen aspect ratio was modified and stretched along the z direction to allow the manual positioning of the marker points in the viewer. (C) XYZ view of a flattened mouse brain coronal section within the IMOD viewer. A warped section is submitted to local compressions/expansions along z the direction, forcing the specimen boundaries onto two parallel planes. The transformation leaves the section volume unchanged.
Figure 3
Figure 3
Before and after flattening. Isosurfaces are plotted for an uncorrected digital section (yellow) and its corrected volume after the flattening (blue).
Figure 4
Figure 4
Aligning adjacent sections. Slices used to register two adjacent sections during the in-plane adjustment. The first slice of a section (i + 1) should match the last slice of the previous section (i).
Figure 5
Figure 5
Aligning serial sections using Mogrifier. Two serial coronal sections (A,B) are shown as they would appear in Mogrifier (i.e., in red and green channels). Image (B) illustrates an example of non-uniform compression of the lateral ventricle in a tissue section. Image (C) shows the overlay of slices (A,B) in the application Mogrifier before applying any transformation. Image (D) shows the overlay of slices (A,B) and the reference points (blue) after applying the thin plate spline transformation in Mogrifier.
Figure 6
Figure 6
Aligning serial sections using ir-Tweak. Image (A) shows a wide-field view of overlaid adjacent slices in the application ir-Tweak (reference points shown as white open circles) before applying any transformation. Image (B) shows a high-magnification image of the hippocampus from (A). This image demonstrates the mis-alignment of serial sections before applying the thin plate spline transformation in ir-Tweak. Image (C) shows the same high-magnification image from (B) after applying the thin plate spline transformation in ir-Tweak.
Figure 7
Figure 7
Volume reconstruction evaluation. (A) A series of three coronal sections was successfully labeled with fluorescent stains, imaged, flattened, and reconstructed using Mogrifier and ir-Tweak. A higher magnification image is shown (B) where the three labels (DiI in red for the blood vessels, FluoroMyelin in green for the myelin, and TO-PRO-3 in blue for the nuclei) are more clearly discernible in the striatum and the cortex. A cross-section (xz plane) of this same sample region is shown in (C). The alignment of the blood vessels (DiI) and FluoroMyelin can be seen more easily in this cross-section. These images were collected in Imaris, an application for 3D visualization and segmentation.

References

    1. Ai Z., Chen X., Rasmussen M., Folberg R. (2005). Reconstruction and exploration of three-dimensional confocal microscopy data in an immersive virtual environment. Comput. Med. Imaging Graph. 29, 313–31810.1016/j.compmedimag.2005.01.003 - DOI - PubMed
    1. Anderson J. R., Jones B. W., Yang J. H., Shaw M. V., Watt C. B., Koshevoy P., Spaltenstein J., Jurrus E., Kannan U. V., Whitaker R. T., Mastronarde D., Tasdizen T., Marc R. E. (2009). A computational framework for ultrastructural mapping of neural circuitry. PLoS Biol. 7, e1000074.10.1371/journal.pbio.1000074 - DOI - PMC - PubMed
    1. Belongie S. (2010). “Thin plate spline,” in From MathWorld – A Wolfram Web Resource, ed. Weisstein E. W. Available at: http://mathworld.wolfram.com/ThinPlateSpline.html
    1. Braumann U. D., Scherf N., Einenkel J., Horn L. C., Wentzensen N., Loeffler M., Kuska J. P. (2007). Large histological serial sections for computational tissue volume reconstruction. Methods Inf. Med. 46, 614–622 - PubMed
    1. Capek M., Bruza P., Janacek J., Karen P., Kubinova L., Vagnerova R. (2009). Volume reconstruction of large tissue specimens from serial physical sections using confocal microscopy and correction of cutting deformations by elastic registration. Microsc. Res. Tech. 72, 110–119 - PubMed

LinkOut - more resources