. 2012 Jan;67(1):110-7.
doi: 10.1002/mrm.22990. Epub 2011 May 31.

Nonexponential T₂ decay in white matter

Affiliations

Nonexponential T₂ decay in white matter

Peter van Gelderen et al. Magn Reson Med. 2012 Jan.

Abstract

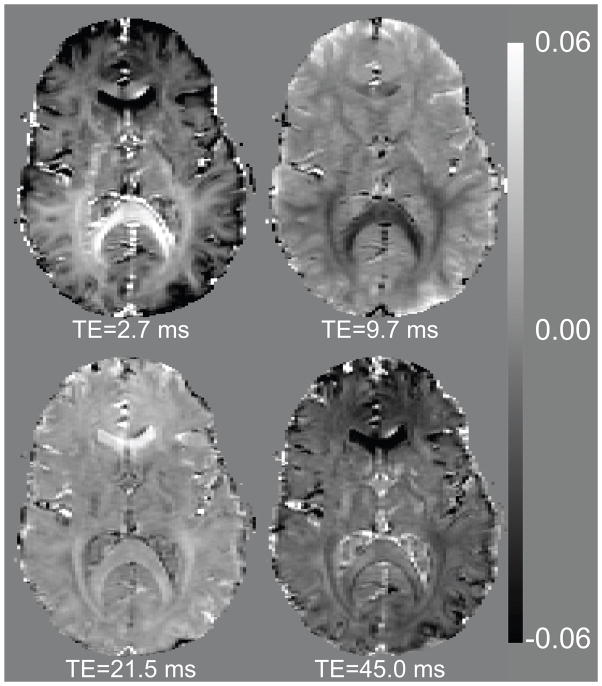
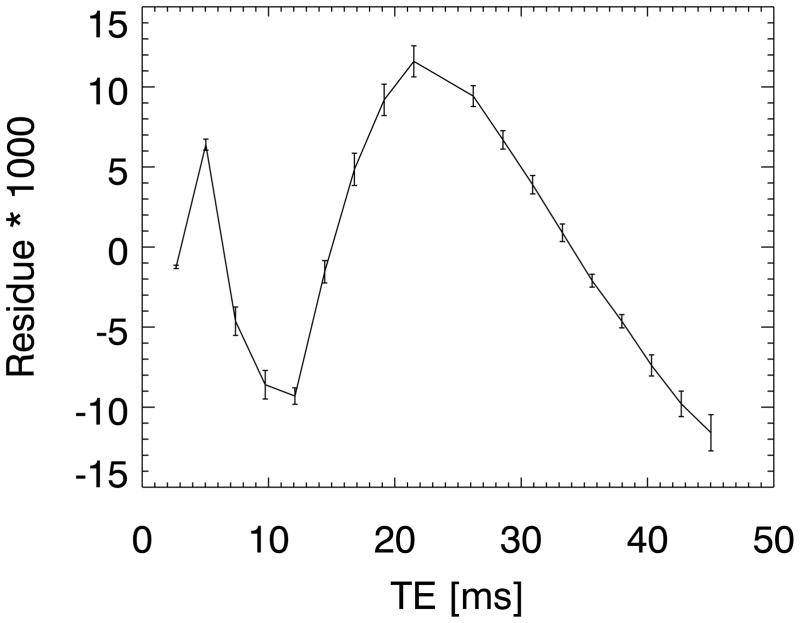
Visualizing myelin in human brain may help the study of diseases such as multiple sclerosis. Previous studies based on T(1) and T(2) relaxation contrast have suggested the presence of a distinct water pool that may report directly on local myelin content. Recent work indicates that T(2) contrast may offer particular advantages over T(1) and T(2) contrast, especially at high field. However, the complex mechanism underlying T(2) relaxation may render interpretation difficult. To address this issue, T(2) relaxation behavior in human brain was studied at 3 and 7 T. Multiple gradient echoes covering most of the decay curve were analyzed for deviations from mono-exponential behavior. The data confirm the previous finding of a distinct rapidly relaxing signal component (T(2) ∼ 6 ms), tentatively attributed to myelin water. However, in extension to previous findings, this rapidly relaxing component displayed a substantial resonance frequency shift, reaching 36 Hz in the corpus callosum at 7 T. The component's fractional amplitude and frequency shift appeared to depend on both field strength and fiber orientation, consistent with a mechanism originating from magnetic susceptibility effects. The findings suggest that T(2) contrast at high field may be uniquely sensitive to tissue myelin content and that proper interpretation will require modeling of susceptibility-induced resonance frequency shifts.


Figures

Figure 1
Figure 1
The difference between a mono-exponential model and the T2*-weighted data at four selected echo times, as fraction of the fitted amplitude for echo time zero. The echo times are indicated below each image. The images show that the deviation from exponential behavior is not limited to the contribution of a fast component, and notably different in contrast for different anatomical structures.
Figure 2
Figure 2
ROIs selection based on R2* maps using diffusion data to identify the structures of interest. The diffusion data were processed to show fractional anisotropy (FA) and a color-coded predominant fiber orientation with green for left-right, red for anterior-posterior and blue for the superior-inferior direction. The three ROIs represent the posterior corpus callosum (CC, red) with predominantly left-right fibers, the posterior internal capsule (PIC, brown) with mostly up-down fibers and a mixed WM area (GWM) in green containing fibers of various orientations and therefore has a lower FA. The scale for the R2* images is in Hz.
Figure 3
Figure 3
a) An example of the decay curve, averaged over a ROI in the splenium of the corpus callosum (SCC), and the corresponding mono-exponential fit for one subject. b) Plots of the subject-averaged differences between the ROI averaged T2* weighted data and a mono-exponential fits. The curves show the mean over 8 studies at 7 T with error bars indicating the standard error of the mean for the three ROIs (see Figure 2 for locations).
Figure 4
Figure 4
Plot of the subject averaged difference between the splenium of the corpus callosum (SCC) ROI data and a mono-exponential fit for 3 T. The error bars reflect the standard error of the mean. The 7 T data is repeated from Fig 3b for comparison.
Figure 5
Figure 5
Results of a 3-compartment model fit (Eq. 1) for the same data as in Fig. 3 (SCC ROI), a) data with the fitted model, b) the residue, scaled up 1000 times.
Figure 6
Figure 6
Image showing the relative amplitude of the fast component of a triple-exponential fit on the right and the difference between the data and a mono-exponential fit at TE 2.7 ms on the left. The triple-exponential model was fitted with the relaxation and frequency parameters fixed to the values found for the CC ROI averaged signal, the image is scaled to reflect the amplitude of the fast component at TE 2.7 ms.
Figure A1
Figure A1
The residue of a ROI averaged decay curve (from the splenium of the corpus callosum) fitted with a triple-exponential model without frequency offsets.
Figure A2
Figure A2
Simulations of the dephasing effects of the susceptibility-induced field inhomogeneity around a) one solid cylinder and b) in and around a bundle of hollow cylinders, all perpendicular to the main field.

References

    1. Wolff SD, Balaban RS. Magnetization transfer contrast (MTC) and tissue water proton relaxation in vivo. Magn Reson Med. 1989;10:135–144. - PubMed
    1. Helms G, Dathe H, Kallenberg K, Dechent P. High-resolution maps of magnetization transfer with inherent correction for RF inhomogeneity and T1 relaxation obtained from 3D FLASH MRI. Magn Reson Med. 2008;60:1396–1407. - PubMed
    1. MacKay A, Whittall K, Adler J, Li D, Paty D, Graeb D. In vivo visualization of myelin water in brain by magnetic resonance. Magn Reson Med. 1994;31:673–677. - PubMed
    1. Oh J, Han ET, Pelletier D, Nelson SJ. Measurement of in vivo multi-component T2 relaxation times for brain tissue using multi-slice T2 prep at 1.5 and 3 T. Magn Reson Imaging. 2006;24:33–43. - PubMed
    1. Deoni SC, Rutt BK, Arun T, Pierpaoli C, Jones DK. Gleaning multicomponent T1 and T2 information from steady-state imaging data. Magn Reson Med. 2008;60:1372–1387. - PubMed

Publication types