. 2011 Jul 6;133(26):10034-7.
doi: 10.1021/ja202902d. Epub 2011 Jun 9.

Imaging intracellular pH in live cells with a genetically encoded red fluorescent protein sensor

Affiliations

Imaging intracellular pH in live cells with a genetically encoded red fluorescent protein sensor

Mathew Tantama et al. J Am Chem Soc. .

Abstract

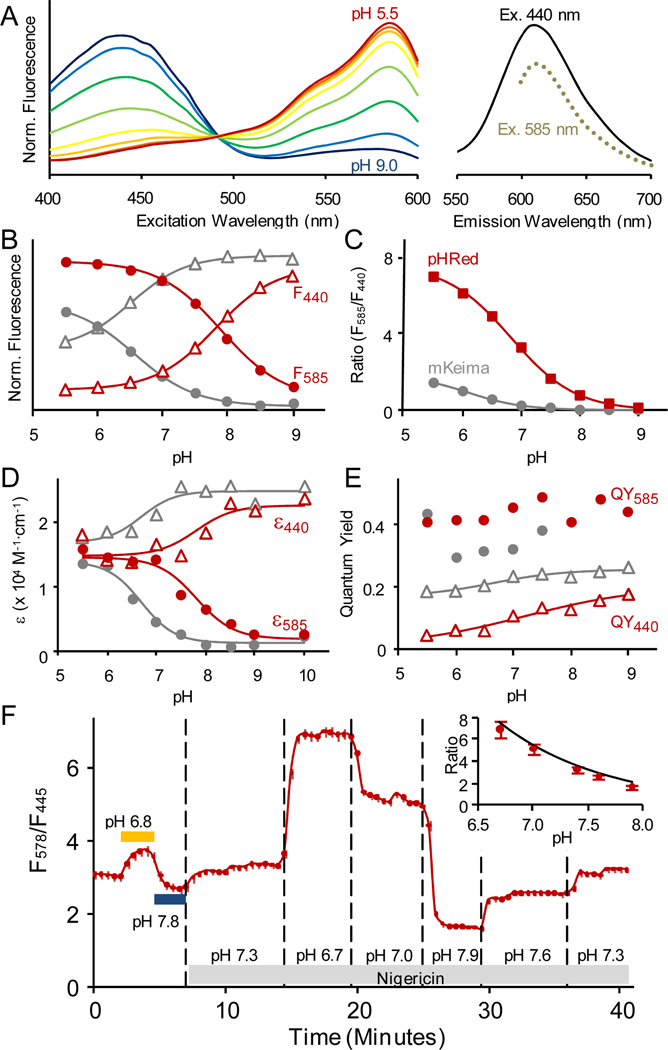
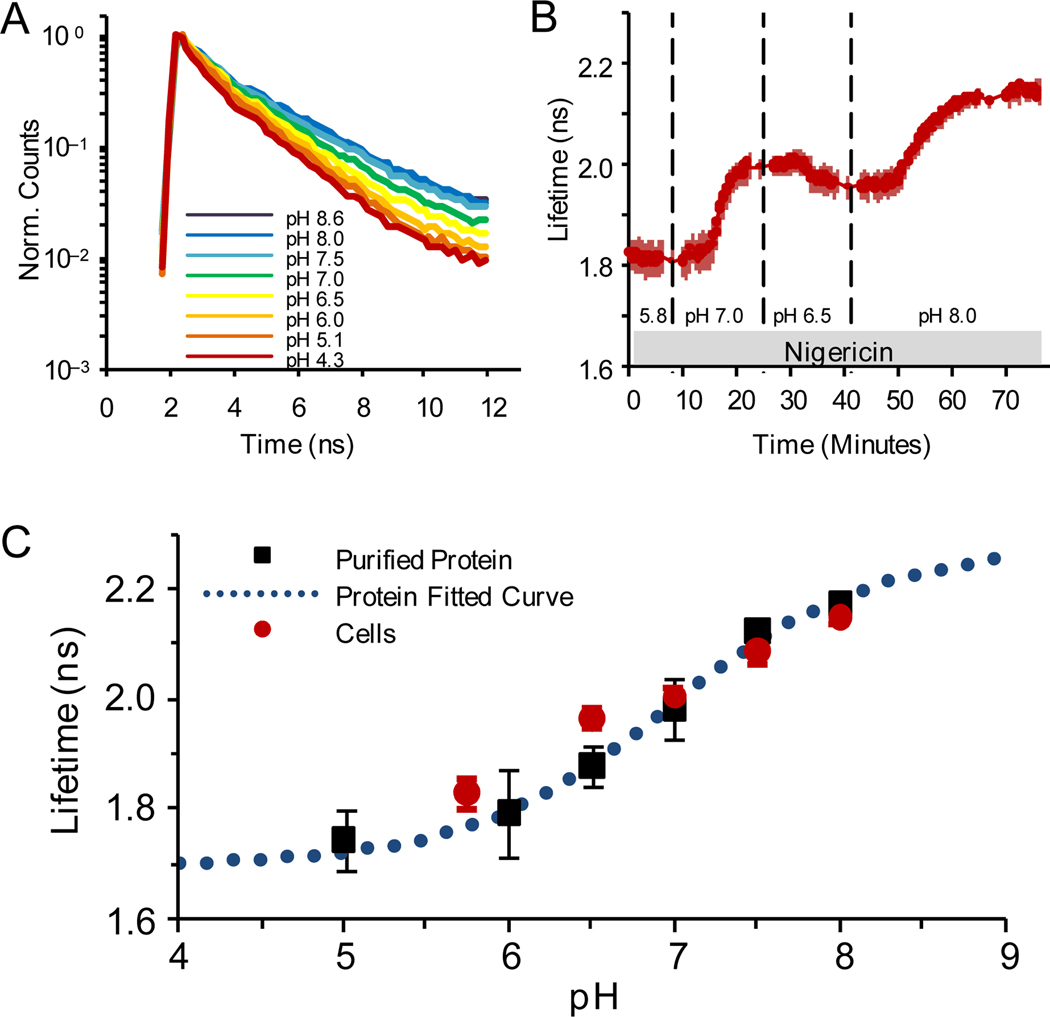
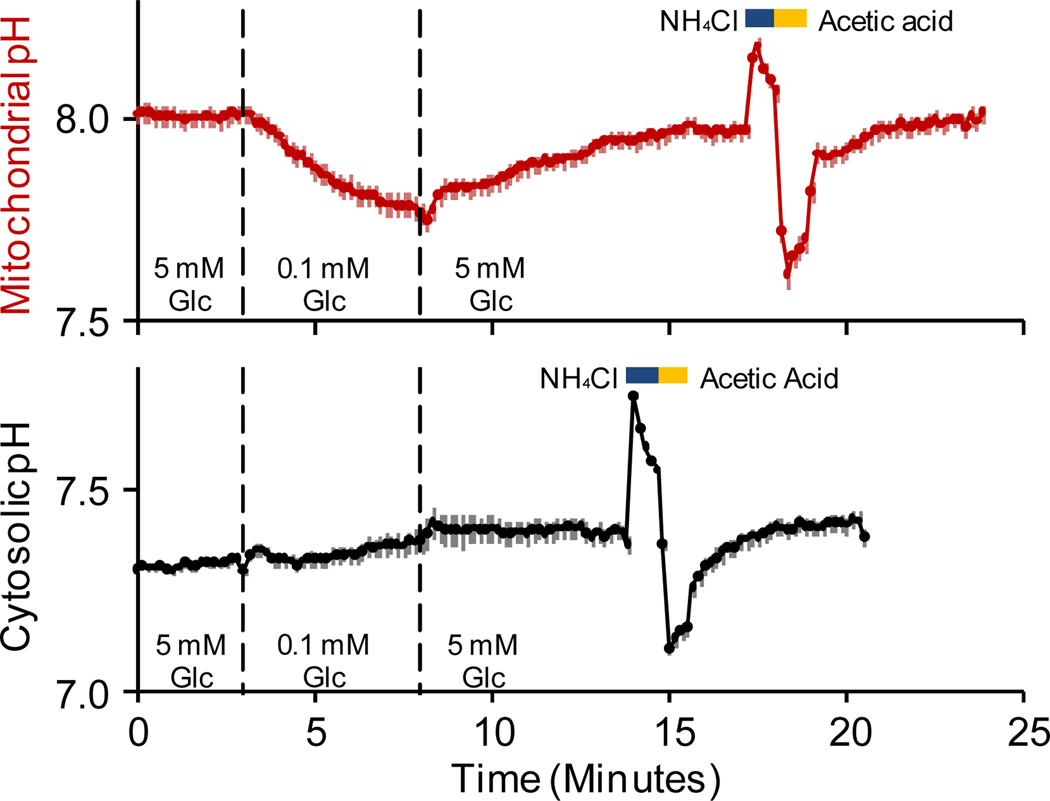
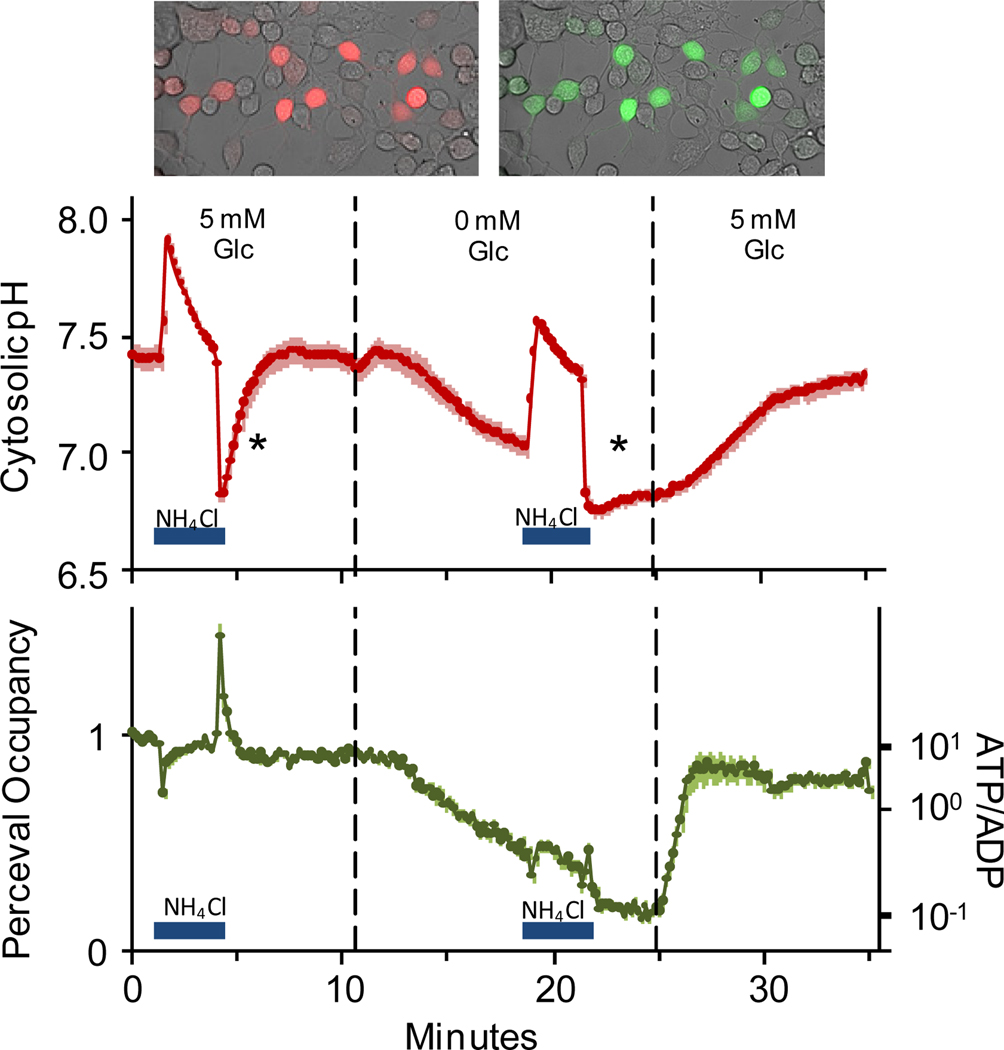
Intracellular pH affects protein structure and function, and proton gradients underlie the function of organelles such as lysosomes and mitochondria. We engineered a genetically encoded pH sensor by mutagenesis of the red fluorescent protein mKeima, providing a new tool to image intracellular pH in live cells. This sensor, named pHRed, is the first ratiometric, single-protein red fluorescent sensor of pH. Fluorescence emission of pHRed peaks at 610 nm while exhibiting dual excitation peaks at 440 and 585 nm that can be used for ratiometric imaging. The intensity ratio responds with an apparent pK(a) of 6.6 and a >10-fold dynamic range. Furthermore, pHRed has a pH-responsive fluorescence lifetime that changes by ~0.4 ns over physiological pH values and can be monitored with single-wavelength two-photon excitation. After characterizing the sensor, we tested pHRed's ability to monitor intracellular pH by imaging energy-dependent changes in cytosolic and mitochondrial pH.


Figures

Figure 1
Figure 1
(a) Fluorescence excitation and emission spectra of purified pHRed in solution. pH response of the (b) 440 nm and 585 nm excitation peak intensities with 620 nm emission, (c) the F585/F440 ratio, (d) extinction coefficients, and (e) quantum yields. (a–b) Fluorescence intensity is normalized to total integrated intensity. (b–e) mKeima data is shown in grey for comparison. (f) pHRed reports intracellular pH in live Neuro2A cells. Changes in extracellular pH without permeabilization caused minor changes to intracellular pH (horizontal bars). The protonophore nigericin was used to manipulate intracellular pH. n=43 cells, bars indicate standard error. Inset: pH calibration in cells agrees well with purified protein (line).
Figure 2
Figure 2
pH response of pHRed fluorescence lifetime (630 nm emission) with 860 nm two-photon excitation. (A) pH response of peak normalized fluorescence lifetime decays of purified pHRed in solution. (B) Intracellular pH in live Neuro2A cells imaged with FLIM. The nigericin method was used to manipulate pH. (C) pH response of pHRed fluorescence lifetime in cells (n=6) and protein in solution (n=3) in solution agreed well with an apparent pKa of 6.9 ± 0.2, similar to the F575/F440 intensity ratio response.
Figure 3
Figure 3
Decreased glucose concentration depletes mitochondrial substrates causing a loss of inner membrane potential, and COX8-pHRed reported a decrease in matrix pH (red, n=17). Cytosolic pH reported by pHRed did not acidify when glucose is lowered (black, n=3). At the end of each experiment, consecutive 10 mM NH4Cl and 10 mM acetic acid pulses were used to verify that pHRed correctly reported an induced intracellular alkalinization and acidification, respectively. Note that the mitochondrial matrix (pH 8.0) rested alkaline relative to the cytosol (pH 7.3).
Figure 4
Figure 4
Co-expression of pHRed and Perceval for simultaneous imaging of the intracellular pH and the ATP/ADP ratio in live Neuro2A cells. Top: pHRed 629 nm (left) and Perceval 525 nm (right) emission in the same cells. Middle: In high glucose, cells rested at pH 7.4 and showed rapid recovery from an acid load induced by a 10 mM NH4Cl prepulse (first asterisk). Complete glucose withdrawal caused acidification, and recovery from an acid load was attenuated (second asterisk). Bottom: Glucose withdrawal caused a decrease in ATP that was promptly reversed with re-feeding. The Perceval signal was pH corrected using pHRed. Small errors in the correction remain at the start and end of the NH4Cl pulses. n=14.

References

    1. Casey JR, Grinstein S, Orlowski J. Nat. Rev. Mol. Cell Biol. 2010;11:50–61. - PubMed
    1. Lagadic-Gossmann D, Huc L, Lecureur V. Cell Death Differ. 2004;11:953–961. - PubMed
    1. Han J, Burgess K. Chem. Rev. 2010;110:2709–2928. - PubMed
    1. Bizzarri R, Serresi M, Luin S, Beltram F. Anal. Bioanal. Chem. 2009;393:1107–1122. - PubMed
    1. Palmer AE, Qin Y, Park JG, McCombs JE. Trends Biotechnol. 2011;29:144–152. - PMC - PubMed

Publication types

Substances