

Association of BMD and FRAX score with risk of fracture in older adults with type 2 diabetes
- PMID: 21632482
- PMCID: PMC3287389
- DOI: 10.1001/jama.2011.715
Association of BMD and FRAX score with risk of fracture in older adults with type 2 diabetes
Abstract
Context: Type 2 diabetes mellitus (DM) is associated with higher bone mineral density (BMD) and paradoxically with increased fracture risk. It is not known if low BMD, central to fracture prediction in older adults, identifies fracture risk in patients with DM.
Objective: To determine if femoral neck BMD T score and the World Health Organization Fracture Risk Algorithm (FRAX) score are associated with hip and nonspine fracture risk in older adults with type 2 DM.
Design, setting, and participants: Data from 3 prospective observational studies with adjudicated fracture outcomes (Study of Osteoporotic Fractures [December 1998-July 2008]; Osteoporotic Fractures in Men Study [March 2000-March 2009]; and Health, Aging, and Body Composition study [April 1997-June 2007]) were analyzed in older community-dwelling adults (9449 women and 7436 men) in the United States.
Main outcome measure: Self-reported incident fractures, which were verified by radiology reports.
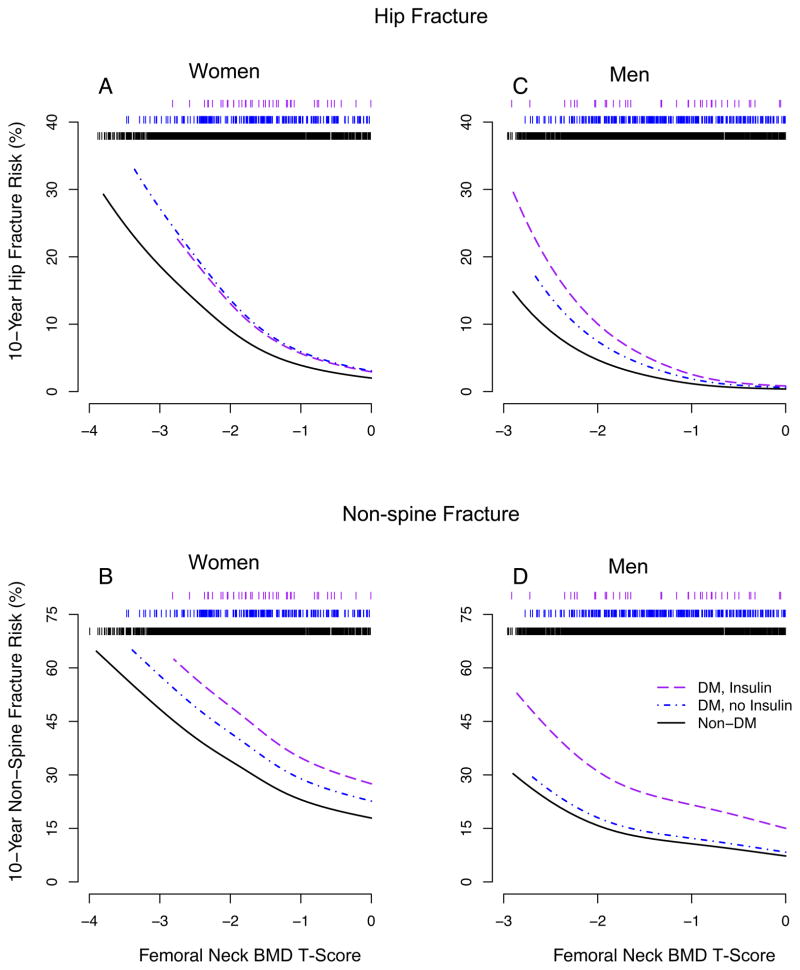
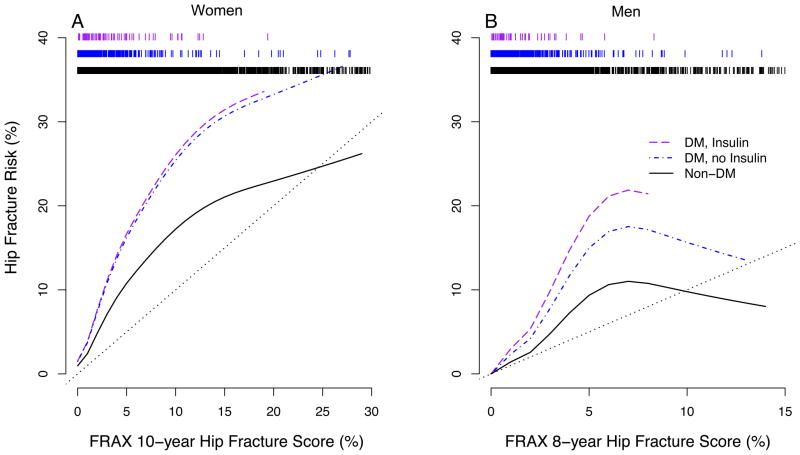
Results: Of 770 women with DM, 84 experienced a hip fracture and 262 a nonspine fracture during a mean (SD) follow-up of 12.6 (5.3) years. Of 1199 men with DM, 32 experienced a hip fracture and 133 a nonspine fracture during a mean (SD) follow-up of 7.5 (2.0) years. Age-adjusted hazard ratios (HRs) for 1-unit decrease in femoral neck BMD T score in women with DM were 1.88 (95% confidence interval [CI], 1.43-2.48) for hip fracture and 1.52 (95% CI, 1.31-1.75) for nonspine fracture, and in men with DM were 5.71 (95% CI, 3.42-9.53) for hip fracture and 2.17 (95% CI, 1.75-2.69) for nonspine fracture. The FRAX score was also associated with fracture risk in participants with DM (HRs for 1-unit increase in FRAX hip fracture score, 1.05; 95% CI, 1.03-1.07, for women with DM and 1.16; 95% CI, 1.07-1.27, for men with DM; HRs for 1-unit increase in FRAX osteoporotic fracture score, 1.04; 95% CI, 1.02-1.05, for women with DM and 1.09; 95% CI, 1.04-1.14, for men with DM). However, for a given T score and age or for a given FRAX score, participants with DM had a higher fracture risk than those without DM. For a similar fracture risk, participants with DM had a higher T score than participants without DM. For hip fracture, the estimated mean difference in T score for women was 0.59 (95% CI, 0.31-0.87) and for men was 0.38 (95% CI, 0.09-0.66).
Conclusions: Among older adults with type 2 DM, femoral neck BMD T score and FRAX score were associated with hip and nonspine fracture risk; however, in these patients compared with participants without DM, the fracture risk was higher for a given T score and age or for a given FRAX score.
Conflict of interest statement
Figures
References
-
- Vestergaard P. Discrepancies in bone mineral density and fracture risk in patients with type 1 and type 2 diabetes--a meta-analysis. Osteoporos Int. 2007 Apr;18(4):427–444. - PubMed
-
- Schwartz AV, Sellmeyer DE, Ensrud KE, et al. Older women with diabetes have an increased risk of fracture: a prospective study. J Clin Endocrinol Metab. 2001;86(1):32–38. - PubMed
-
- Strotmeyer ES, Cauley JA, Schwartz AV, et al. Nontraumatic fracture risk with diabetes mellitus and impaired fasting glucose in older white and black adults: the health, aging, and body composition study. Arch Intern Med. 2005 Jul 25;165(14):1612–1617. - PubMed
-
- Bonds DE, Larson JC, Schwartz AV, et al. Risk of fracture among women with type 2 diabetes: the women’s health initiative observational study. J Clin Endocrinol Metab. 2006 Sep;91(9):3404–3410. - PubMed
Publication types
MeSH terms
Substances
Grants and funding
- U01 AR45632/AR/NIAMS NIH HHS/United States
- R01-AG028050/AG/NIA NIH HHS/United States
- N01-AG-6-2101/AG/NIA NIH HHS/United States
- K24 AR051895/AR/NIAMS NIH HHS/United States
- N01-AG-6-2103/AG/NIA NIH HHS/United States
- U01 AR45647/AR/NIAMS NIH HHS/United States
- U01 AR045654/AR/NIAMS NIH HHS/United States
- R01 AG005407/AG/NIA NIH HHS/United States
- U01-AG027810/AG/NIA NIH HHS/United States
- U01 AG042140/AG/NIA NIH HHS/United States
- R01 AG028050/AG/NIA NIH HHS/United States
- N01-AG-6-2106/AG/NIA NIH HHS/United States
- U01 AR45583/AR/NIAMS NIH HHS/United States
- R01 AR35582/AR/NIAMS NIH HHS/United States
- R01 AR035583/AR/NIAMS NIH HHS/United States
- R01 AR035584/AR/NIAMS NIH HHS/United States
- R01-NR012459/NR/NINR NIH HHS/United States
- U01 AR45614/AR/NIAMS NIH HHS/United States
- N01 AG062106/AG/NIA NIH HHS/United States
- R01 AG027576/AG/NIA NIH HHS/United States
- U01 AR045614/AR/NIAMS NIH HHS/United States
- U01 AR45654/AR/NIAMS NIH HHS/United States
- R01 NR012459/NR/NINR NIH HHS/United States
- U01 AR045583/AR/NIAMS NIH HHS/United States
- R01 AR35583/AR/NIAMS NIH HHS/United States
- U01 AR045647/AR/NIAMS NIH HHS/United States
- U01 AR45580/AR/NIAMS NIH HHS/United States
- R01 AR035582/AR/NIAMS NIH HHS/United States
- R01 AR35584/AR/NIAMS NIH HHS/United States
- U01 AG027810/AG/NIA NIH HHS/United States
- R01 AG005394/AG/NIA NIH HHS/United States
- UL1 RR024140/RR/NCRR NIH HHS/United States
- U01 AR045580/AR/NIAMS NIH HHS/United States
- R01 AG027574/AG/NIA NIH HHS/United States
- U01 AG18197/AG/NIA NIH HHS/United States
- U01 AG018197/AG/NIA NIH HHS/United States
- U01 AR066160/AR/NIAMS NIH HHS/United States
- U01 AR045632/AR/NIAMS NIH HHS/United States
LinkOut - more resources
Full Text Sources
Medical
Miscellaneous
