Review
. 2011 Jul 22;286(29):25427-33.
doi: 10.1074/jbc.R111.233478. Epub 2011 Jun 1.

New applications of mass spectrometry in lipid analysis

Affiliations
Review

New applications of mass spectrometry in lipid analysis

Robert C Murphy et al. J Biol Chem. .

Abstract

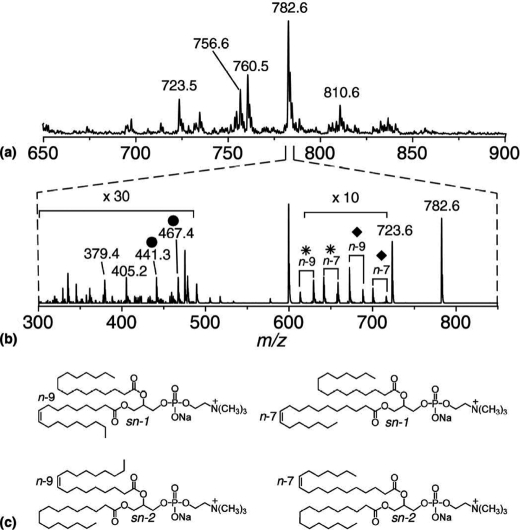
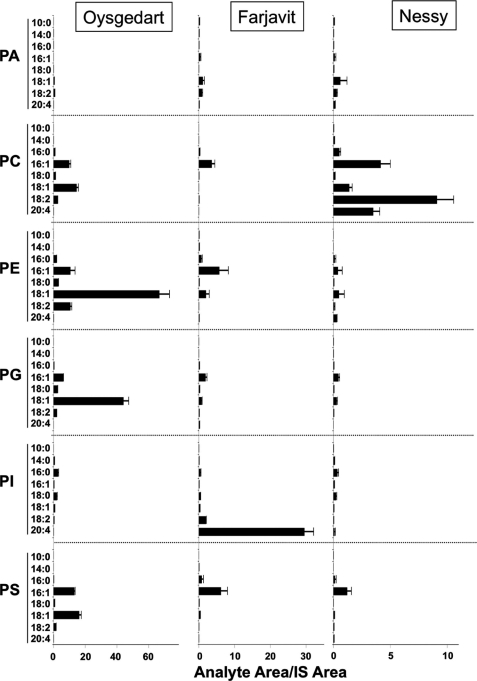
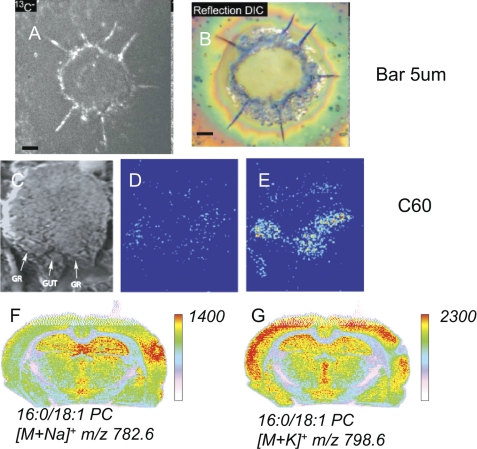
Mass spectrometry has emerged as a powerful tool for the analysis of all lipids. Lipidomic analysis of biological systems using various approaches is now possible with a quantitative measurement of hundreds of lipid molecular species. Although availability of reference and internal standards lags behind the field, approaches using stable isotope-labeled derivative tagging permit precise determination of specific phospholipids in an experimental series. The use of reactivity of ozone has enabled assessment of double bond positions in fatty acyl groups even when species remain in complex lipid mixtures. Rapid scanning tandem mass spectrometers are capable of quantitative analysis of hundreds of targeted lipids at high sensitivity in a single on-line chromatographic separation. Imaging mass spectrometry of lipids in tissues has opened new insights into the distribution of lipid molecular species with promising application to study pathophysiological events and diseases.


Figures

FIGURE 1.
FIGURE 1.
Ozone reaction with phospholipids in the collision cell of a linear ion trap mass spectrometer. a, ESI mass spectrum obtained by direct infusion of a crude lipid extract from cow brain. b, combined CID-ozone identification mass spectrum acquired by applying collision energy to the mass-selected precursor ion at m/z 782.6 with ozone vapor present in the collision cell (q2). c, molecular structure of four regioisomeric lipids that could give rise to the combined spectral features observed in b. This figure has been reprinted with permission from the American Chemical Society (31).
FIGURE 2.
FIGURE 2.
Dual choice LAT enzyme assay by selected ion recording and LC-MS/MS. The fly MBOAT proteins Oys, Frj, and Nes were expressed in the acyltransferase-deficient ale1Δ yeast strain. Isolated microsomes containing the fly proteins were incubated with a mixture of eight acyl-CoA species and six lysophospholipids, and the products formed by each enzyme were separated and quantified by LC-MS/MS. Scales were adjusted to highlight the substrate preferences of each enzyme. Results given are the mean ± S.E. of three experiments. Acyl-CoAs are abbreviated as x:y, where x is the number of carbon atoms in the chain and y is the number of double bonds. This figure has been reprinted with permission from the American Society for Cell Biology (36).
FIGURE 3.
FIGURE 3.
Imaging of lipids using MS. A, SIMS imaging of fatty acid transport in cultured adipocytes after unwashed 3T3F442A adipocytes were incubated with [13C]oleate. Images are of 13C. Scale bar = 5 μm. This figure has been reprinted with permission as open access from Ref. . B, optical image using a reflection differential interference contrast microscope of the same cells before analysis with SIMS. Reflection differential interference contrast (DIC) images (magnification ×500) were obtained using a Nikon Eclipse E800 upright microscope. Scale bar = 5 μm. This figure has been reprinted with permission as open access from Ref. . C, scanning ion image of an axial slice from a 9-day-old mouse embryo. The gut and genital ridge (GR) are identified by white arrows. D and E, SIMS images of cholesterol (m/z 366–370) from the tissue in the SIMS image. The image in E was taken before a sputter dose of 1 × 10¹³ C60+60+/cm2, and the image in C was taken after nanotome sputtering. This figure has been reprinted with permission from Elsevier (39). F and G, rat brain sections from a traumatic brain injury model and imaging by MALDI-IMS corresponding to 16:0/18:1 PC ([M + Na]+, m/z 782.6) and 16:0/18:1 PC ([M + K]+, m/z 798.6), respectively (51).

Comment in

References

    1. Ryhage R., Stenhagen E. (1960) J. Lipid Res. 1, 361–390 - PubMed
    1. Granström E., Samuelsson B. (1969) J. Am. Chem. Soc. 91, 3398–3400 - PubMed
    1. VanLear G. E., McLafferty F. W. (1969) Annu. Rev. Biochem. 38, 289–322 - PubMed
    1. Barber M., Bordoli R. S., Sedgwick R. D., Tyler A. M. (1981) Nature 293, 270–275
    1. Murphy R. C., Mathews W. R., Rokach J., Fenselau C. (1982) Prostaglandins 23, 201–206 - PubMed

Publication types

LinkOut - more resources